Fig. 1
Download original image
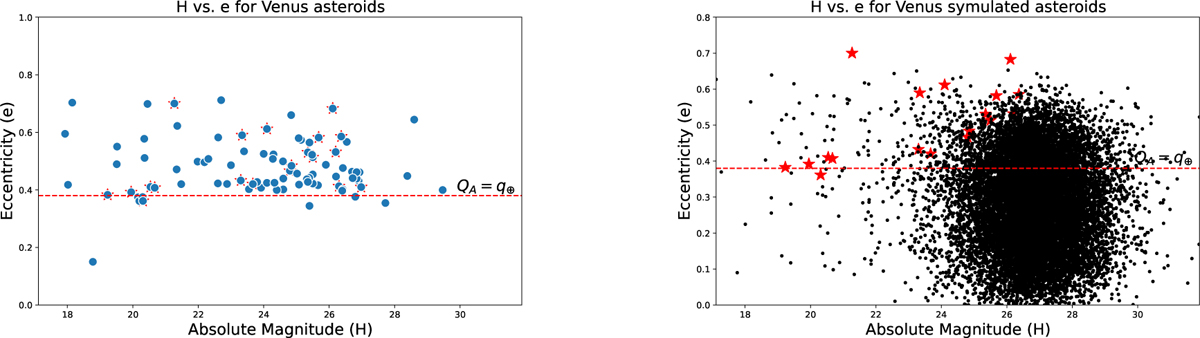
Left: distribution in the (H, e) plane of known asteroids near Venus (blue full circles) and its co-orbital asteroids (red stars). The horizontal dashed line shows the limit for which the apocenter of Venus’ co-orbitals (QA) can be equal to the Earth’s pericenter (q⊕). Right: distribution of 14382 simulated NEAs obtained from the NEOMOD3 model (black dots). The other symbols have the same meaning as in the left panel.
Current usage metrics show cumulative count of Article Views (full-text article views including HTML views, PDF and ePub downloads, according to the available data) and Abstracts Views on Vision4Press platform.
Data correspond to usage on the plateform after 2015. The current usage metrics is available 48-96 hours after online publication and is updated daily on week days.
Initial download of the metrics may take a while.