Fig. 2.
Download original image
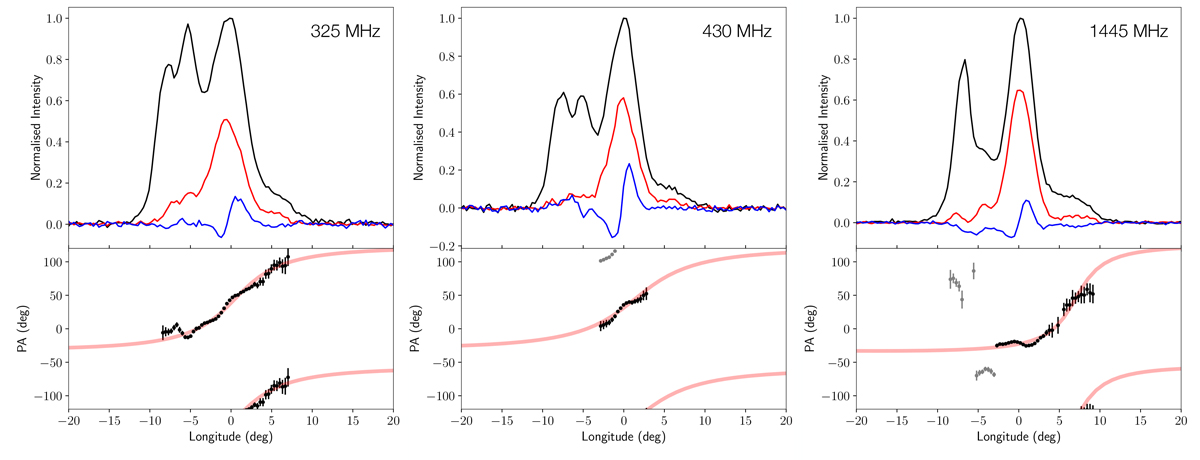
Pulse profiles of PSR B1931+24 at (left) 325 MHz, (middle) 430 MHz, and (right) 1445 MHz, respectively. In each plot, the top panel shows the total (black) and linearly (red) and circularly polarised (blue) intensity. The bottom panels show the position angle of the linearly polarised intensity. Modelling the distinct S-like swing with an RVM results in the red line. The 430 MHz profile is from this work; the 325 MHz and 1445 MHz profile are from Rankin et al. (2023) as obtained from the EPN database (see text for details).
Current usage metrics show cumulative count of Article Views (full-text article views including HTML views, PDF and ePub downloads, according to the available data) and Abstracts Views on Vision4Press platform.
Data correspond to usage on the plateform after 2015. The current usage metrics is available 48-96 hours after online publication and is updated daily on week days.
Initial download of the metrics may take a while.