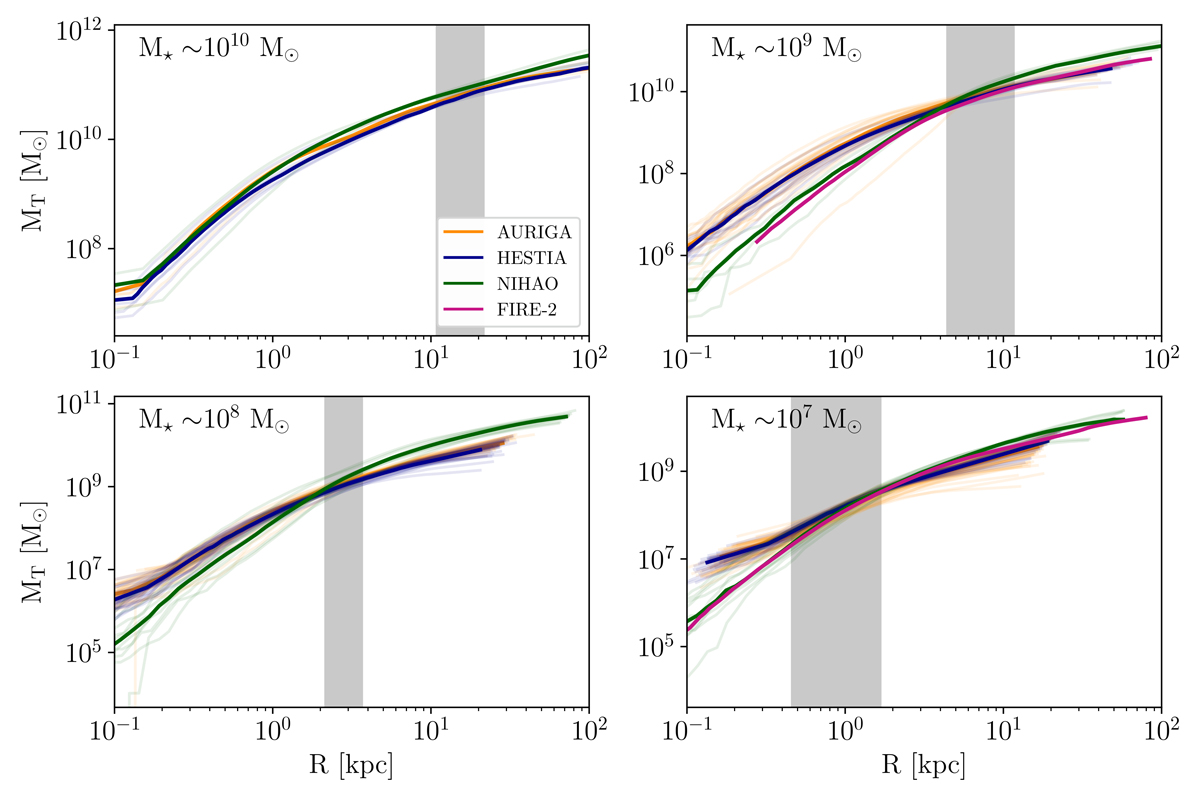
Fig. A.1.
Download original image
Cumulative total mass versus radius across four stellar mass ranges. Each simulation suite is coloured according to the colour code of the simulation suite. For each simulation suite, we select z = 0 galaxies at 1010, 109, 108 and 107 M⊙ (from top left to bottom right), within a bin of ±0.5dex. The median cumulative total mass profile is shown with a solid thick line in orange, blue, green and pink for the AURIGA, HESTIA, NIHAO and FIRE-2 galaxies, respectively. The vertical grey region covers all the R1 values found for each stellar mass range.
Current usage metrics show cumulative count of Article Views (full-text article views including HTML views, PDF and ePub downloads, according to the available data) and Abstracts Views on Vision4Press platform.
Data correspond to usage on the plateform after 2015. The current usage metrics is available 48-96 hours after online publication and is updated daily on week days.
Initial download of the metrics may take a while.