Fig. 8.
Download original image
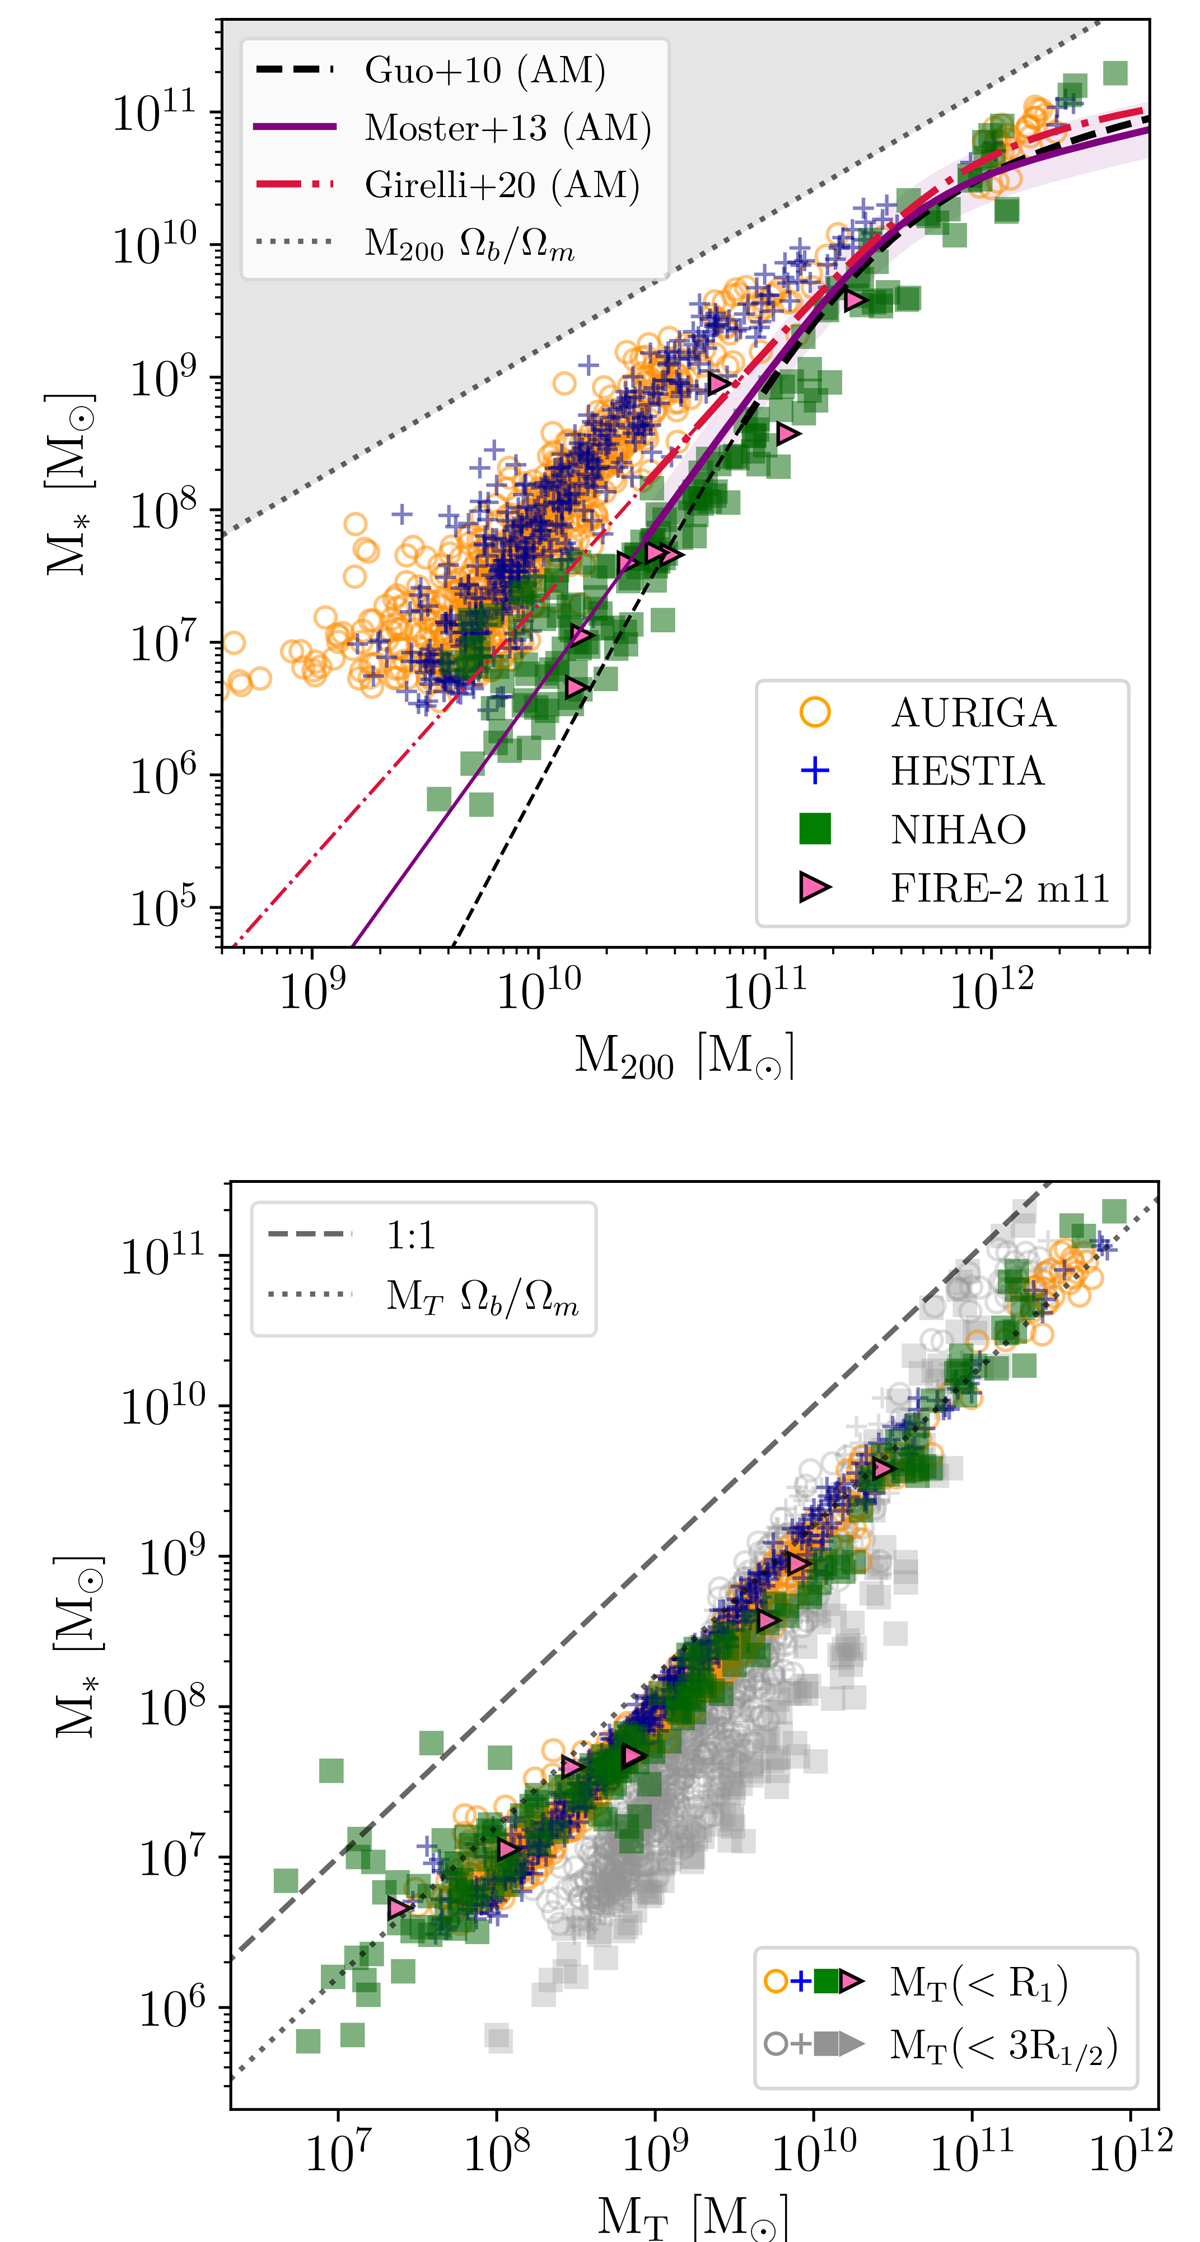
Upper panel: stellar-to-halo mass relation (SHMR) for each of the simulation suites. In solid purple, the abundance matching relation from Moster et al. (2013) is shown with a 0.2 dex scatter. The dashed dark and dash-dotted magenta lines represent estimates by Guo et al. (2010) and Girelli et al. (2020), respectively. Thick lines correspond to the range where the abundance matching relations are constrained by observations, while the thin lines are extrapolations. Bottom panel: stellar mass versus total mass within R1 (STMR), where the stellar mass is measured within 20% of R200. The dashed line represents the 1:1 relation. The universal baryon fraction is shown with a dotted line in both cases. Empty orange dots, blue crosses, green squares, and pink triangles represent the AURIGA, HESTIA, NIHAO, and FIRE-2 samples, respectively. For comparison, we also show in grey squares, dots, and crosses the STMR within 3R1/2.
Current usage metrics show cumulative count of Article Views (full-text article views including HTML views, PDF and ePub downloads, according to the available data) and Abstracts Views on Vision4Press platform.
Data correspond to usage on the plateform after 2015. The current usage metrics is available 48-96 hours after online publication and is updated daily on week days.
Initial download of the metrics may take a while.