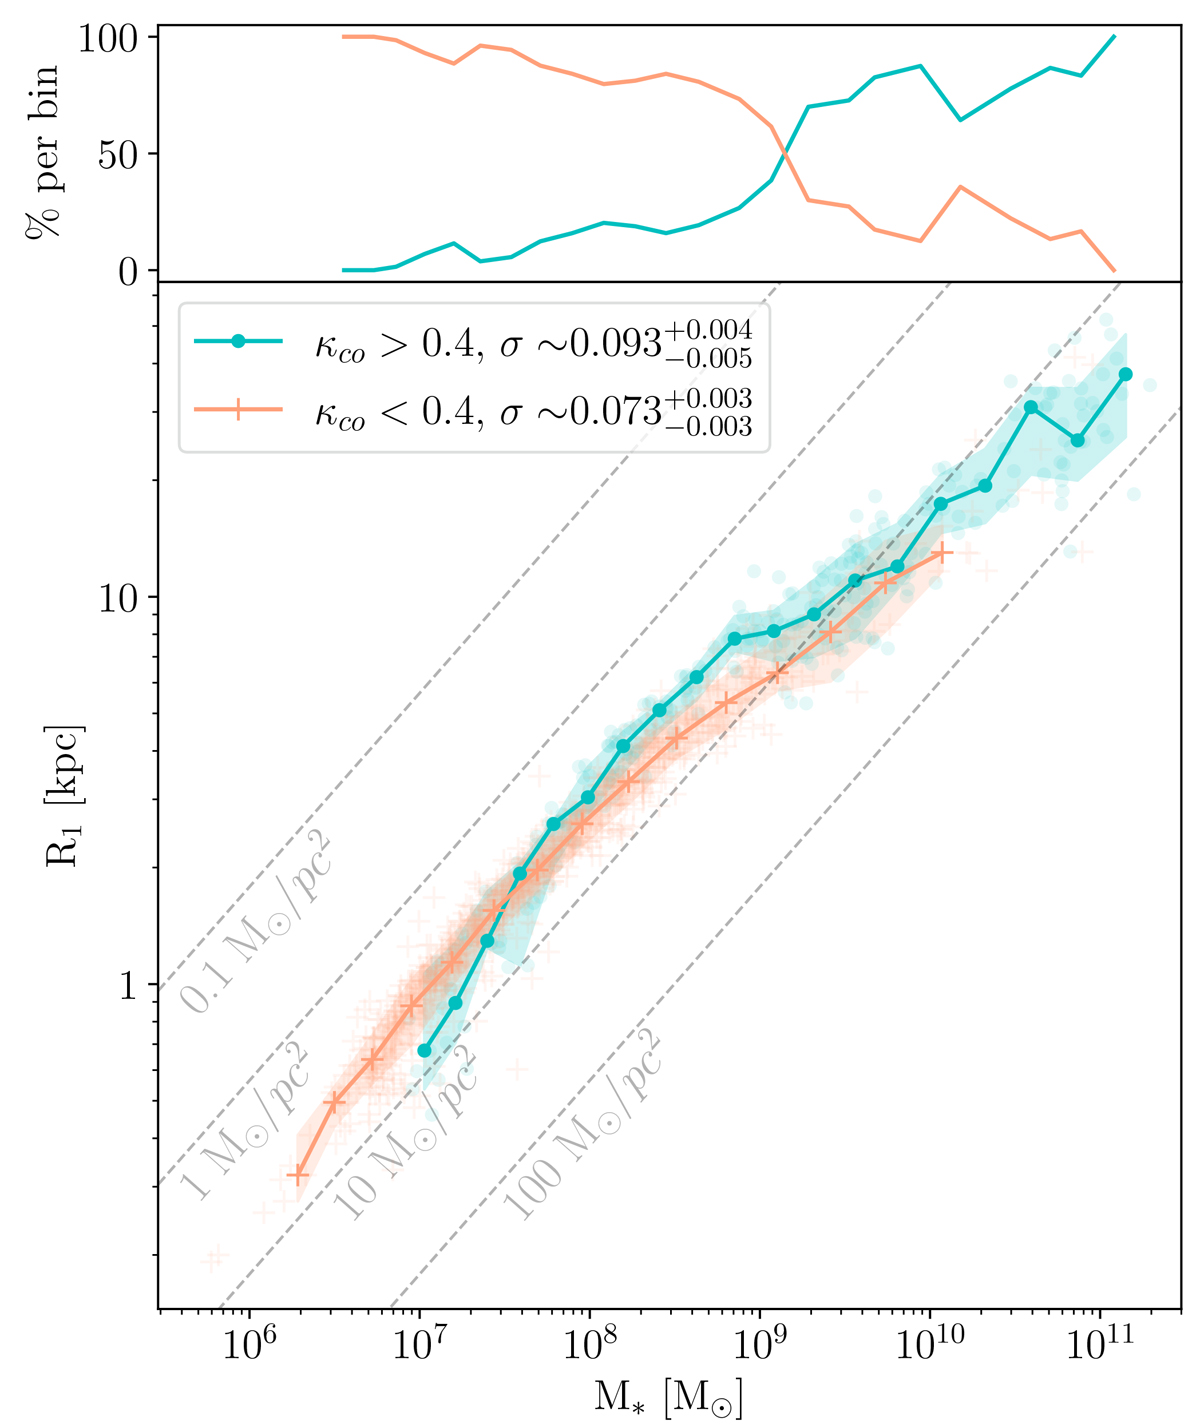
Fig. 6.
Download original image
R1 as a function of galaxy stellar mass, measured within 20% of R200, for all galaxies in the three simulations of our sample. Each of them is characterised as rotational (shown in blue) or dispersion (shown in pink) supported, following the criteria of Sales et al. (2010) and Correa et al. (2017). The median size value has been measured across 20 stellar mass bins in each case. We also show as shaded regions the 1σ error for both classifications. The top panel represents the percentage of galaxies in each morphology per bin, following the same colour code as the main panel. The global FWHM of the relation was found by fitting a Gaussian distribution, and it is indicated in the legend as σ, whose errors were computed via bootstrapping.
Current usage metrics show cumulative count of Article Views (full-text article views including HTML views, PDF and ePub downloads, according to the available data) and Abstracts Views on Vision4Press platform.
Data correspond to usage on the plateform after 2015. The current usage metrics is available 48-96 hours after online publication and is updated daily on week days.
Initial download of the metrics may take a while.