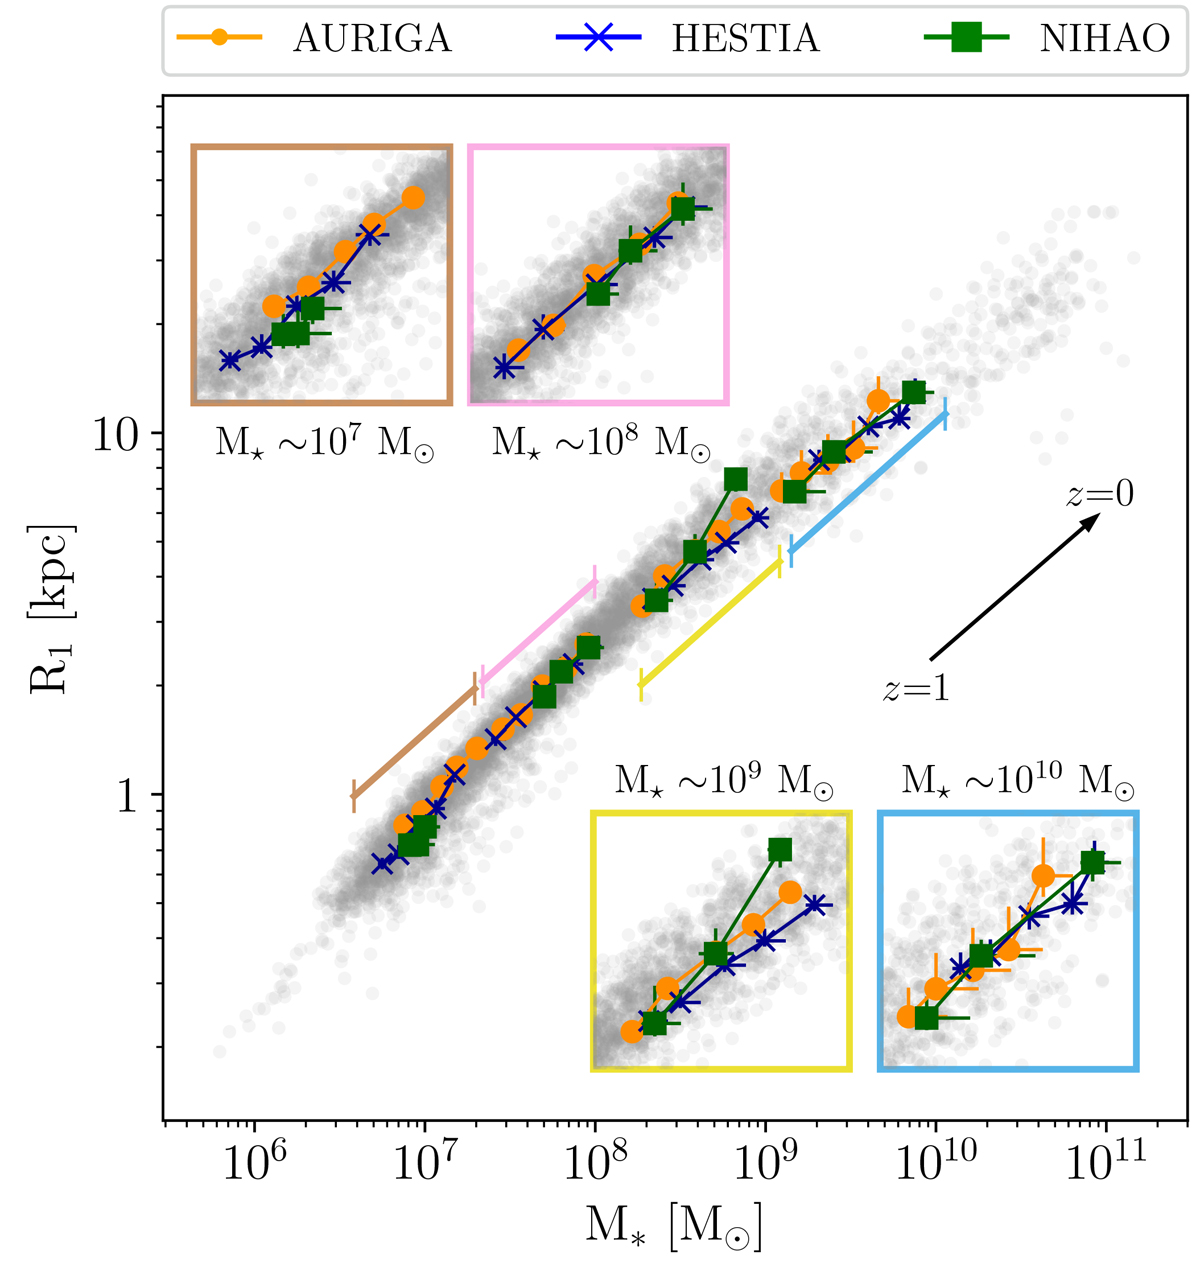
Fig. 5.
Download original image
Evolution of R1 as a function of galaxy stellar mass, measured within 20% of R200, over four different stellar mass ranges. For each simulation suite, we selected z = 0 galaxies at 107, 108, 109, and 1010 M⊙, within a bin of ±0.5 dex, and tracked their size-evolution over redshift up to z = 1, using five increasing z, from left to right. Each of the stellar mass ranges selected is indicated and zoomed in with brown, pink, yellow, and blue regions, respectively. The median value of the size and the stellar mass has been measured for each of the redshifts. Orange dots represent the size evolution of the AURIGA suite, while blue crosses and green squares indicate the HESTIA and NIHAO samples, respectively. The whole sample at z = 0, regardless of the simulation suite, is also shown as grey dots.
Current usage metrics show cumulative count of Article Views (full-text article views including HTML views, PDF and ePub downloads, according to the available data) and Abstracts Views on Vision4Press platform.
Data correspond to usage on the plateform after 2015. The current usage metrics is available 48-96 hours after online publication and is updated daily on week days.
Initial download of the metrics may take a while.