Fig. 3.
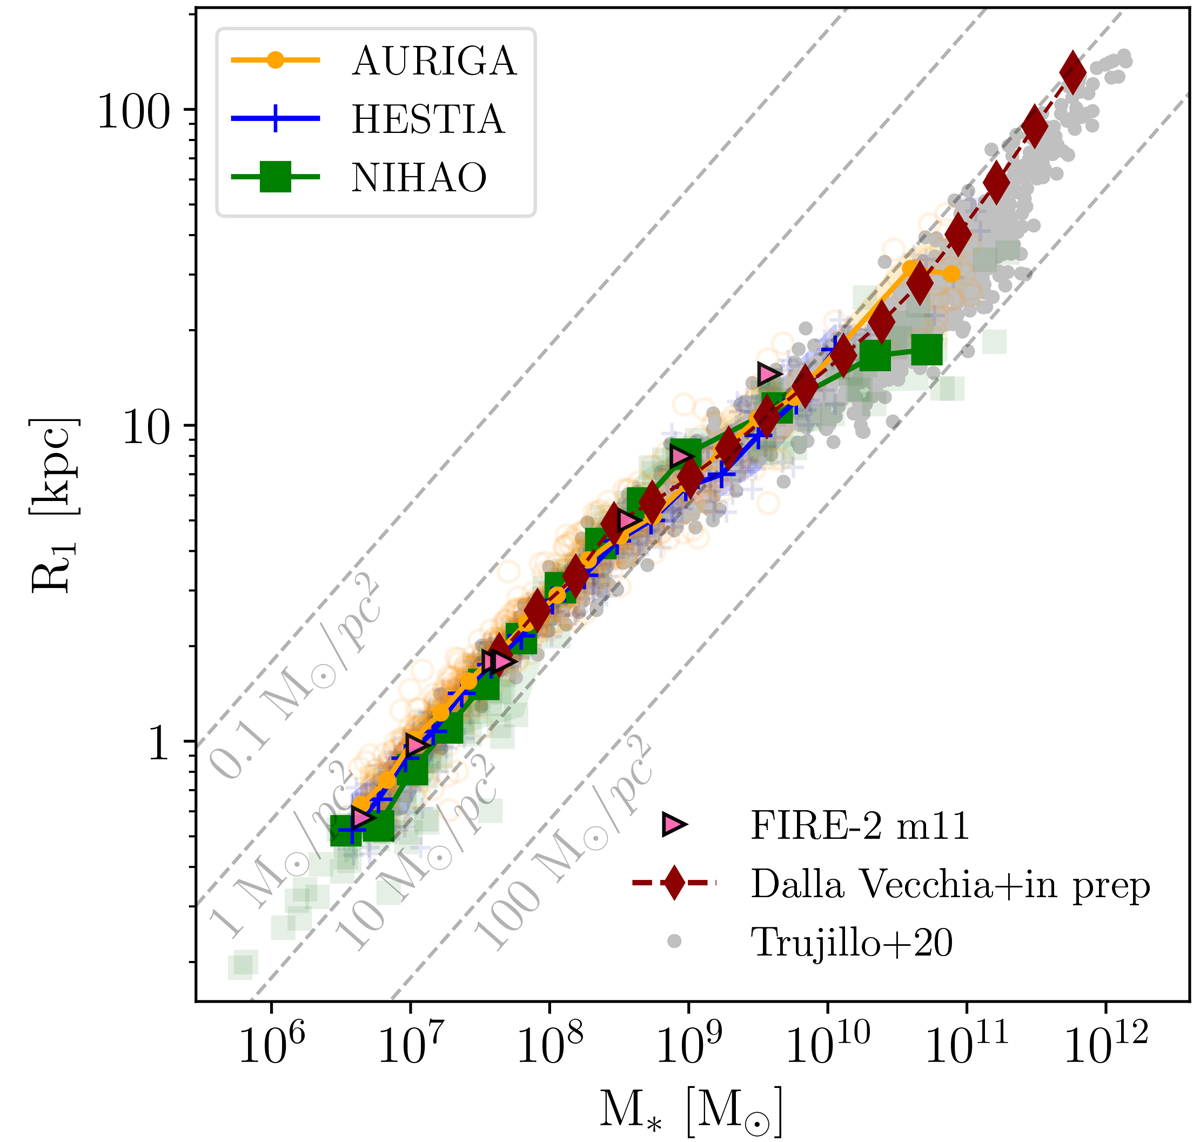
Download original image
R1 as a function of the stellar mass of galaxies, measured within 20% of R200, for different simulation suites, as is indicated in the legend. We show the median value of R1 measured within 20 stellar mass bins, equally spaced. Orange, blue, and green relations correspond to the AURIGA, HESTIA, and NIHAO samples. In addition, we also show in pink single FIRE-2 low-mass galaxies and the relation found by Dalla Vecchia & Trujillo in prep., using public data from EAGLE simulations in red. To compare with Trujillo et al. (2020), we add in grey their observational results as well as dashed lines, corresponding to locations in the place with a constant projected stellar mass density of (from top to bottom) 0.1, 1, 10, and 100 M⊙/pc2.
Current usage metrics show cumulative count of Article Views (full-text article views including HTML views, PDF and ePub downloads, according to the available data) and Abstracts Views on Vision4Press platform.
Data correspond to usage on the plateform after 2015. The current usage metrics is available 48-96 hours after online publication and is updated daily on week days.
Initial download of the metrics may take a while.