Fig. 2.
Download original image
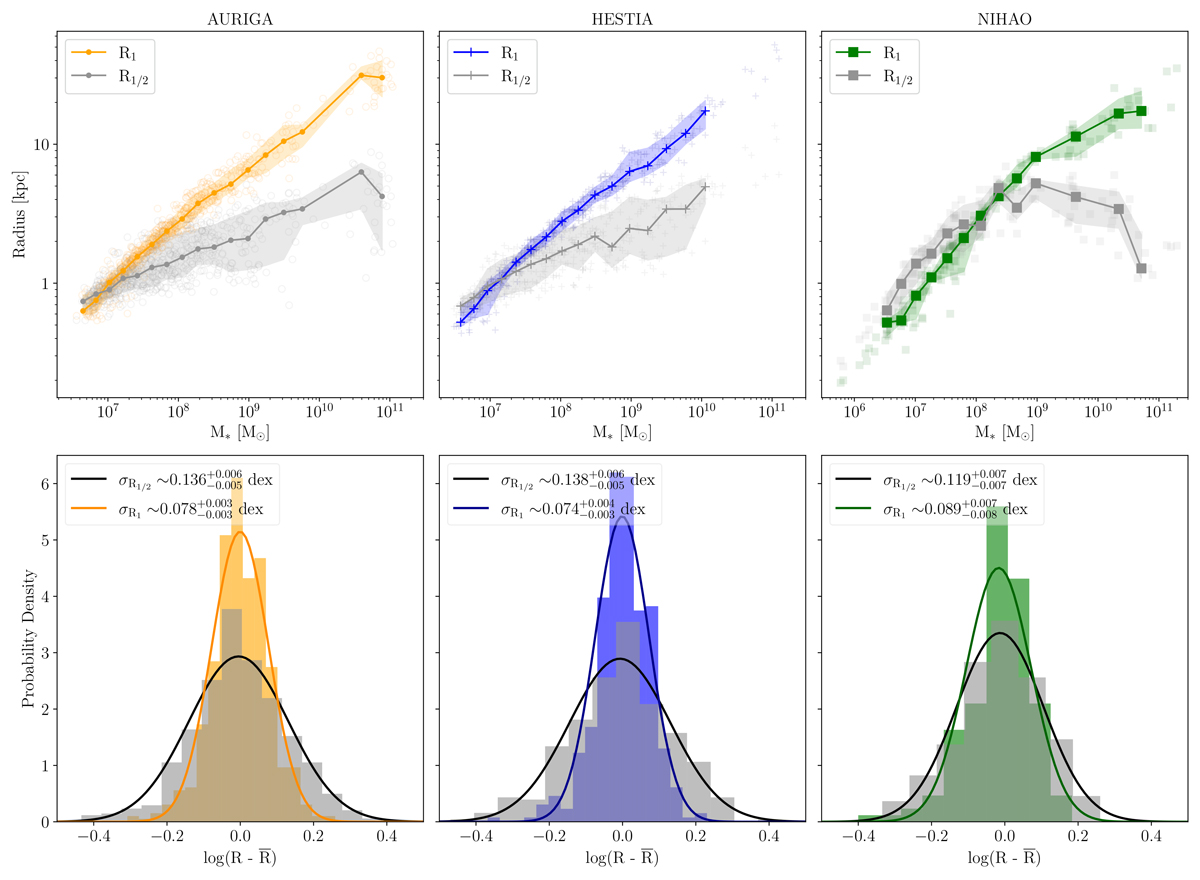
Top panels: size–stellar mass relation for each of the simulation suites used in this work, where the stellar mass is measured within 20% of R200. The median values and 1σ scatter of the stellar half-mass radius in each stellar mass bin are shown by the grey lines and shaded regions, respectively. Likewise, the median values and 1σ scatter of galaxy size defined as R1 is shown for AURIGA (orange), HESTIA (blue), and NIHAO (green) by the lines and shaded regions, respectively. The sizes of individual galaxies are shown with dots (AURIGA), crosses (HESTIA), and squares (NIHAO), using the same colour criteria. Bottom panels: Normalised histograms of the distribution of galaxy sizes relative to the median (![]() ) for each simulation suite. In each case, the global σ of the relation was found by fitting a Gaussian distribution (solid line following the same colour of the respective histogram) and σ was defined as the standard deviation of the respective Gaussian, whose errors were computed via bootstrapping.
) for each simulation suite. In each case, the global σ of the relation was found by fitting a Gaussian distribution (solid line following the same colour of the respective histogram) and σ was defined as the standard deviation of the respective Gaussian, whose errors were computed via bootstrapping.
Current usage metrics show cumulative count of Article Views (full-text article views including HTML views, PDF and ePub downloads, according to the available data) and Abstracts Views on Vision4Press platform.
Data correspond to usage on the plateform after 2015. The current usage metrics is available 48-96 hours after online publication and is updated daily on week days.
Initial download of the metrics may take a while.