Fig. B.1.
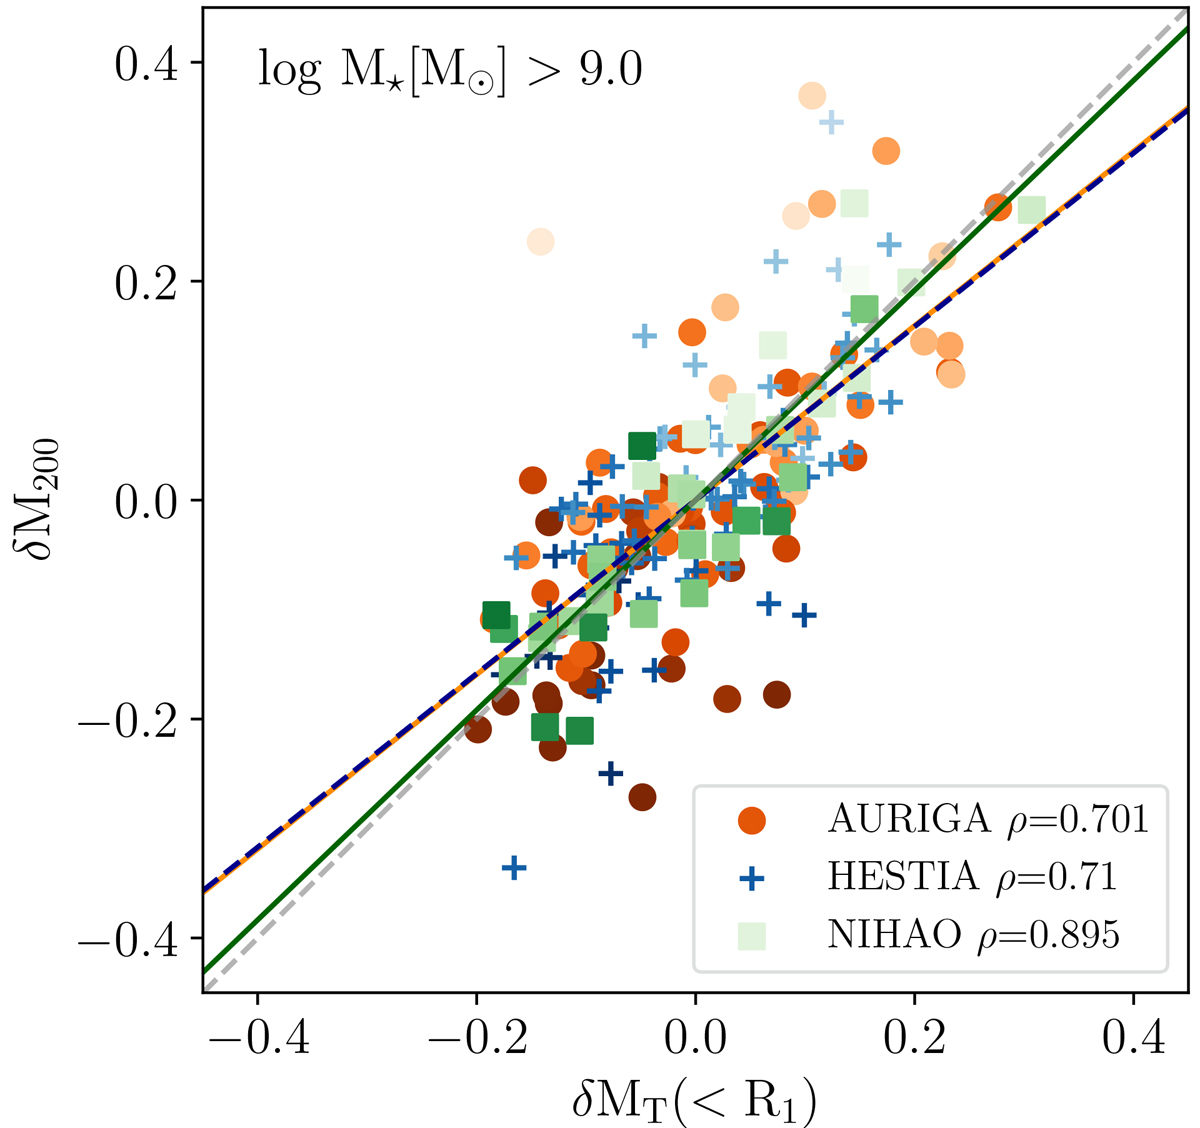
Download original image
Halo mass versus total mass within R1. We show the δM200 and δMT(< R1) residuals from the log M200 − log M⋆ versus log MT(< R1) − log M⋆ relations, for galaxies with M⋆ > 109 M⊙. AURIGA, HESTIA and NIHAO galaxies are shown with orange dots, blue crosses and green squares. Every galaxy is coloured by the concentration of its halo, with darker colours referring to higher concentration and vice versa. Every suite is upper and lower limited by a halo concentration value of 40 and 7, respectively. Best-fitting is shown following the same colour code used for each simulation suite, along with their Spearman rank correlation coefficients. We also show, within dashed grey, the 1:1 line for reference.
Current usage metrics show cumulative count of Article Views (full-text article views including HTML views, PDF and ePub downloads, according to the available data) and Abstracts Views on Vision4Press platform.
Data correspond to usage on the plateform after 2015. The current usage metrics is available 48-96 hours after online publication and is updated daily on week days.
Initial download of the metrics may take a while.