Fig. 1.

Download original image
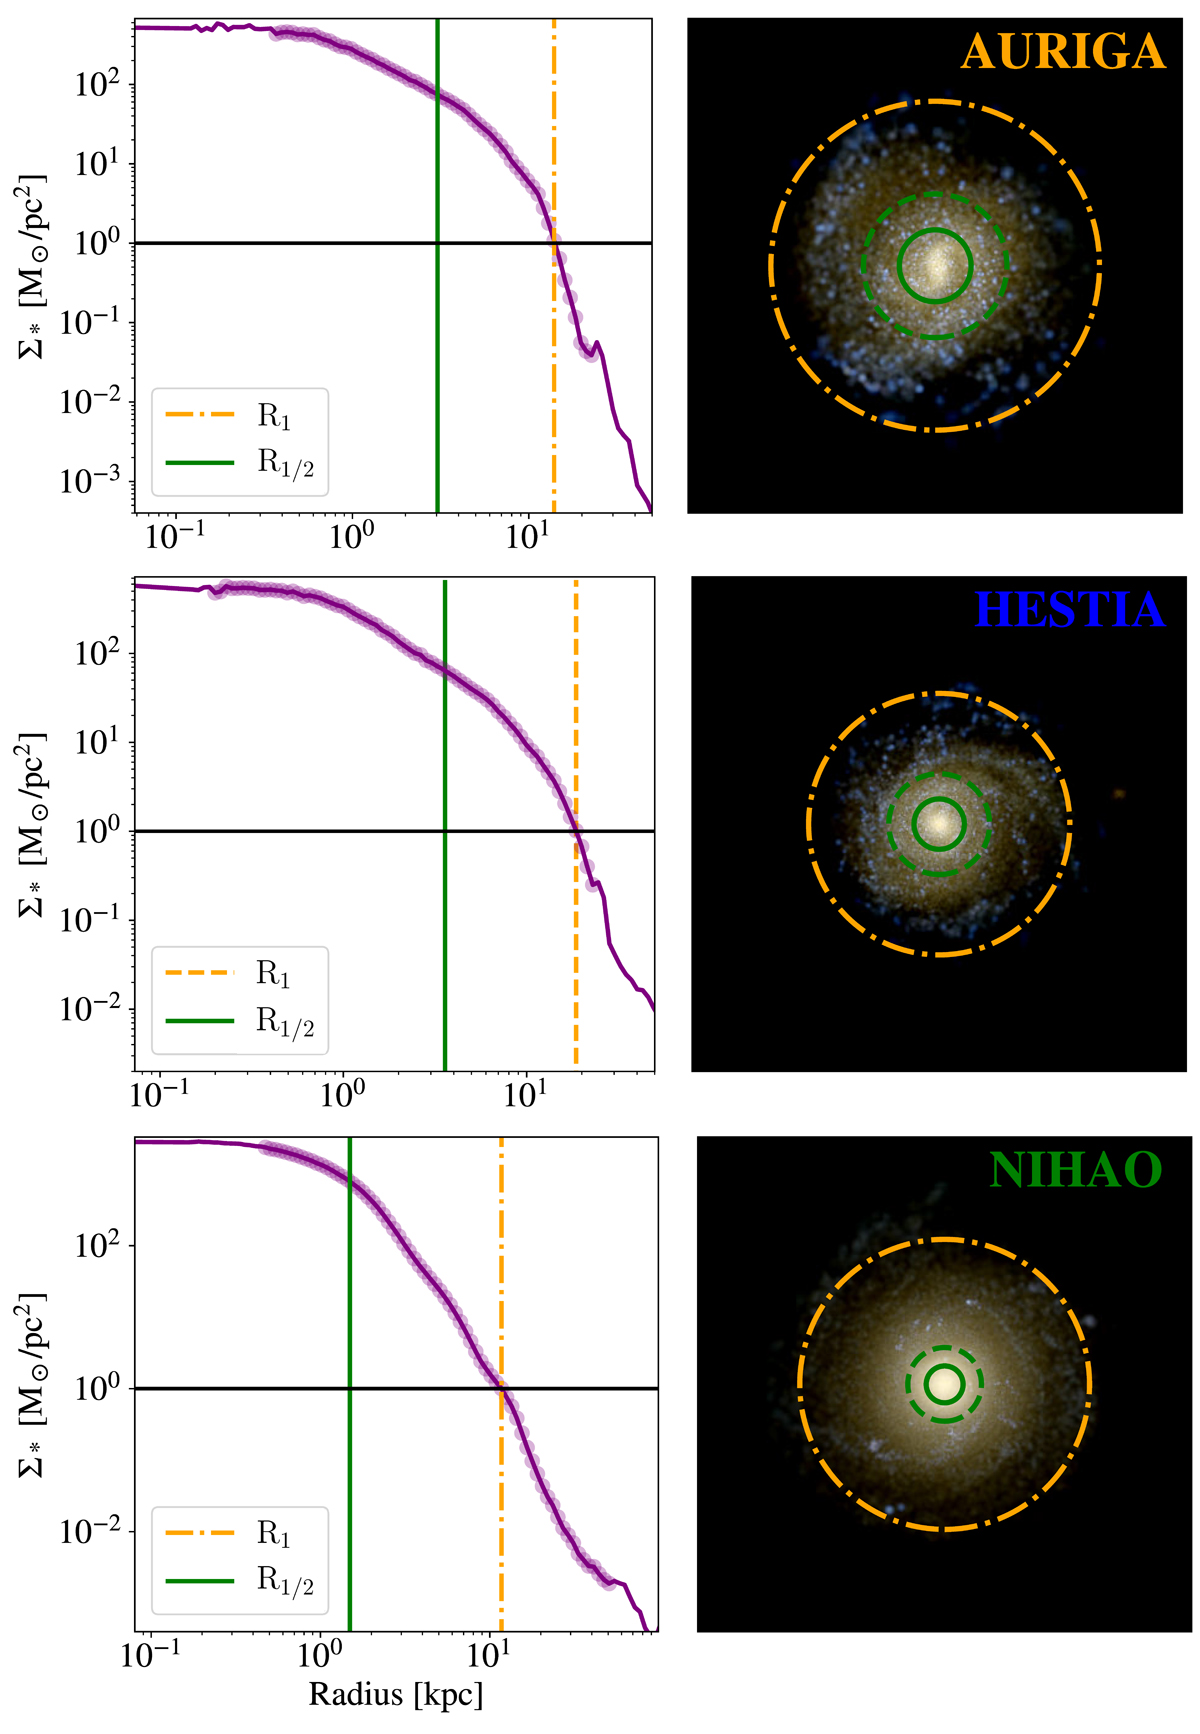
Left-hand panels: Stellar surface density profile for three MW-like galaxies in the sample at z = 0. Right-hand panels: face-on projected stellar light images of the corresponding galaxies. The colours are based on the i-, g-, and u- band luminosities of stars. As is indicated in the right-hand panels, every row refers to a simulation suite. From top to bottom: AURIGA, HESTIA, and NIHAO with the corresponding stellar masses of 1.07 × 10¹⁰ M⊙, 1.56 × 10¹⁰ M⊙, and 2.15 × 10¹⁰ M⊙. Solid green and dash-dotted orange lines indicate the stellar half-mass and R1 radius, respectively. In the right-hand panels, a dashed green line is also incorporated to show the position of twice the stellar half-mass radius.
Current usage metrics show cumulative count of Article Views (full-text article views including HTML views, PDF and ePub downloads, according to the available data) and Abstracts Views on Vision4Press platform.
Data correspond to usage on the plateform after 2015. The current usage metrics is available 48-96 hours after online publication and is updated daily on week days.
Initial download of the metrics may take a while.


