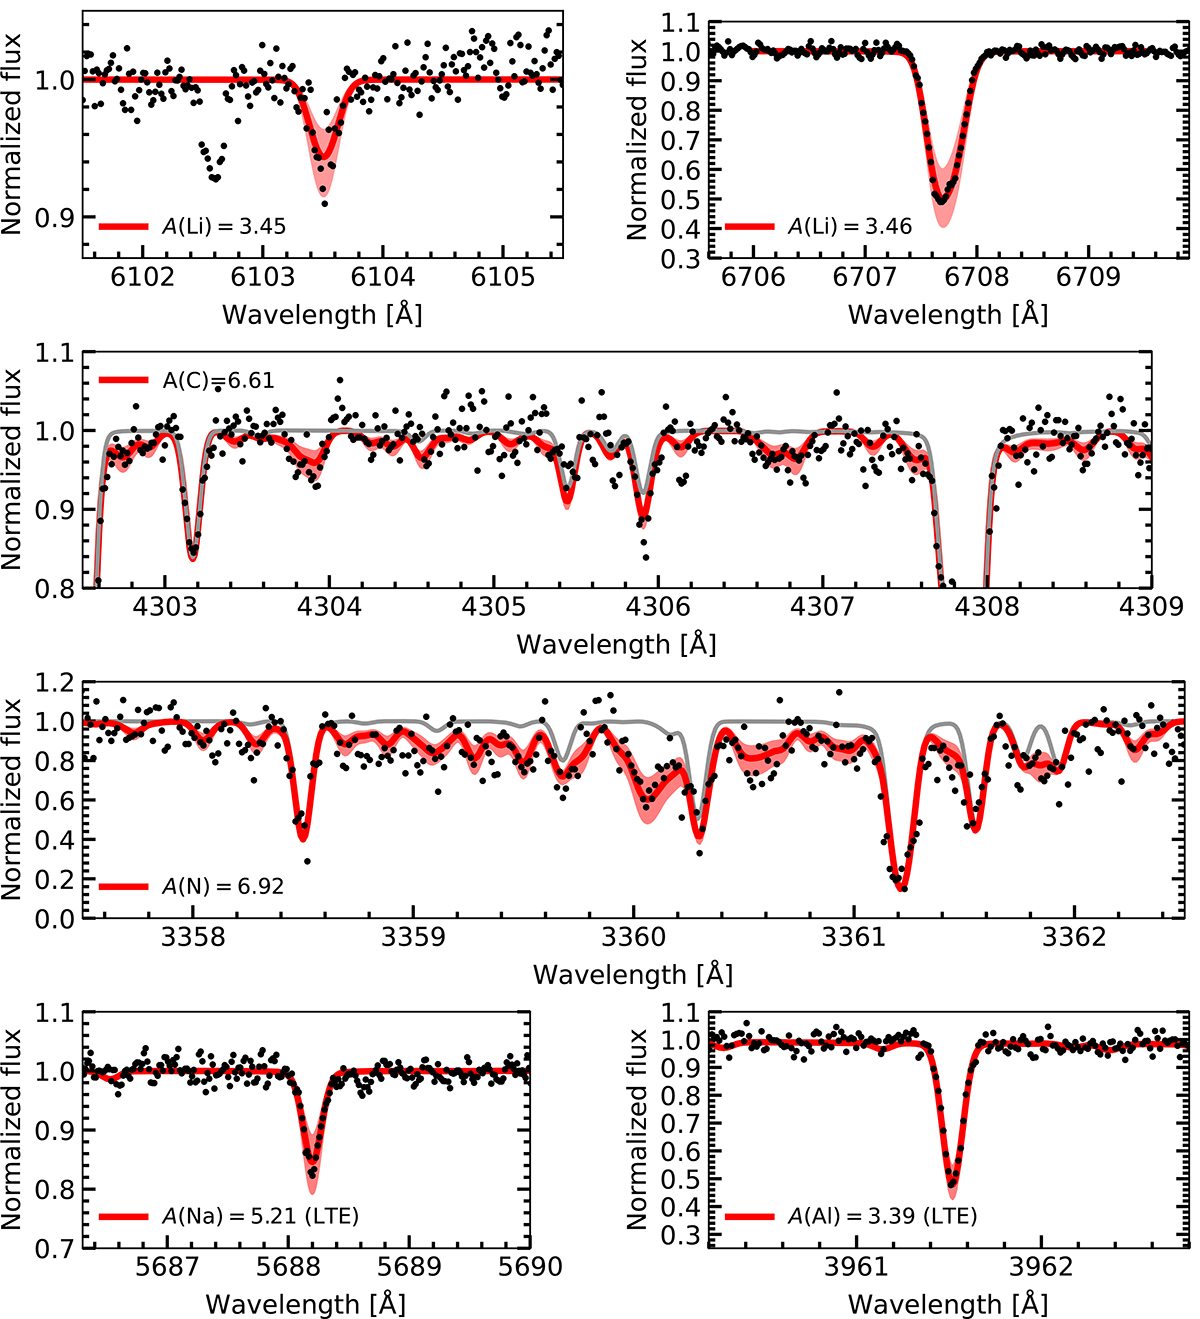
Fig. A.1.
Download original image
Portion of the spectrum of D25_6334. The observed spectrum is shown with black dots, and the best-fit synthetic spectra are shown with red lines. The shaded regions show spectra computed with the abundance of the element of ±0.2 dex from the best-fit. The gray lines in the middle two panels show the synthetic spectra with extremely low abundances of C and N, respectively. Note that while spectral fitting was done in LTE, non-LTE correction was applied to Na and Al abundances.
Current usage metrics show cumulative count of Article Views (full-text article views including HTML views, PDF and ePub downloads, according to the available data) and Abstracts Views on Vision4Press platform.
Data correspond to usage on the plateform after 2015. The current usage metrics is available 48-96 hours after online publication and is updated daily on week days.
Initial download of the metrics may take a while.