Fig. 6.
Download original image
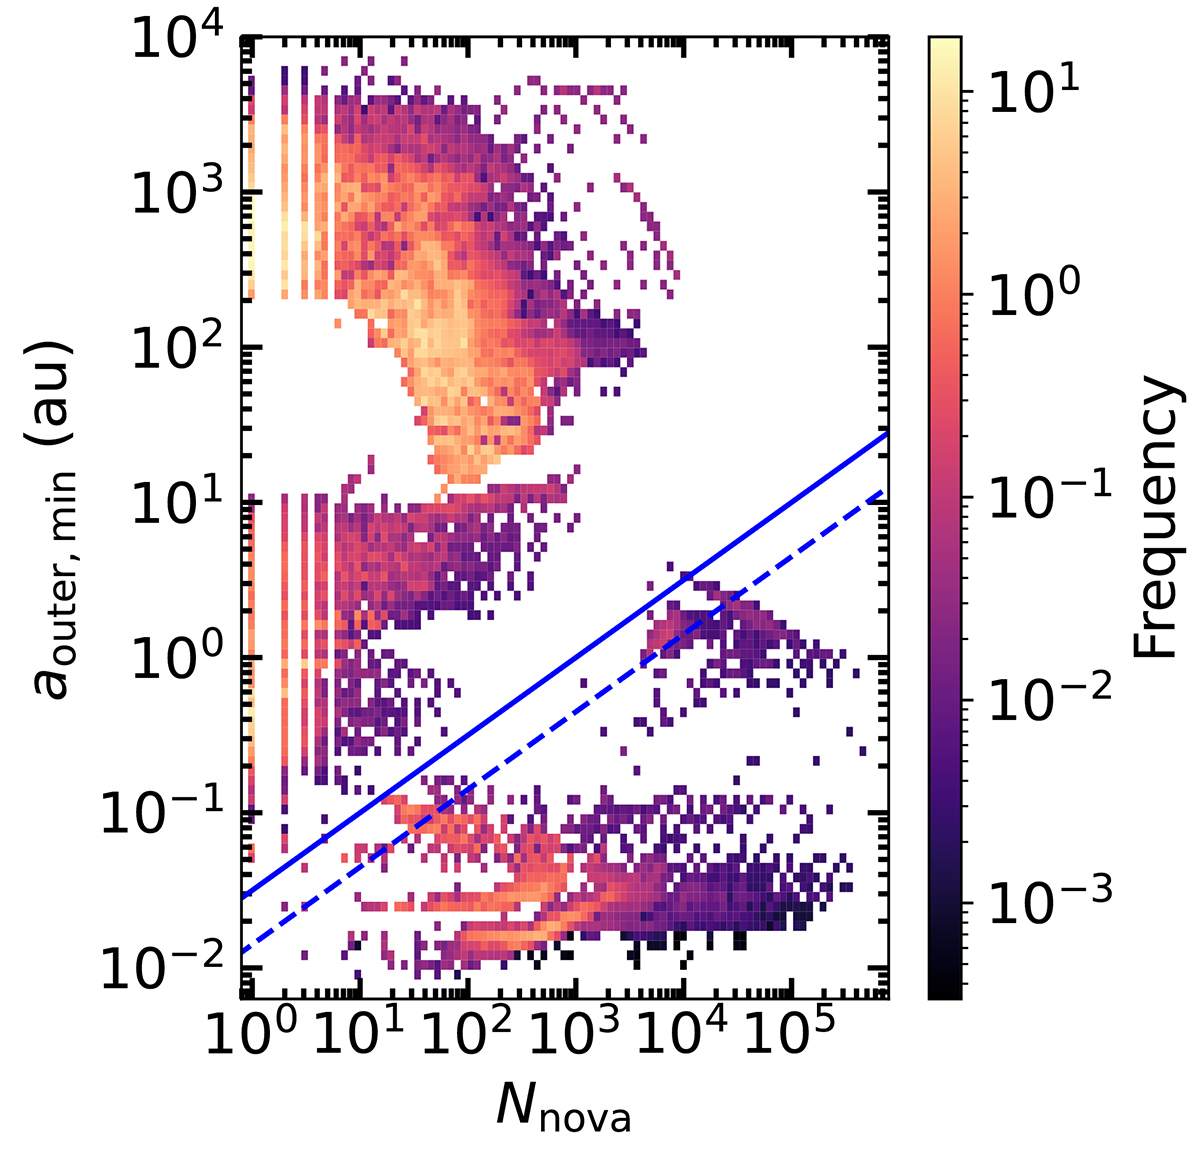
Distribution of nova systems from Kemp et al. (2021) in the space of the minimum separation between the nova and the tertiary (aouter,min) for the stability of the triple-star system and the number of nova explosions (Nnova). The dashed blue line corresponds to the condition Eq. (7), while the solid blue line marks the selection of promising models. The reason for the use of the solid line instead of the dashed line is explained in the text.
Current usage metrics show cumulative count of Article Views (full-text article views including HTML views, PDF and ePub downloads, according to the available data) and Abstracts Views on Vision4Press platform.
Data correspond to usage on the plateform after 2015. The current usage metrics is available 48-96 hours after online publication and is updated daily on week days.
Initial download of the metrics may take a while.