Fig. 5.
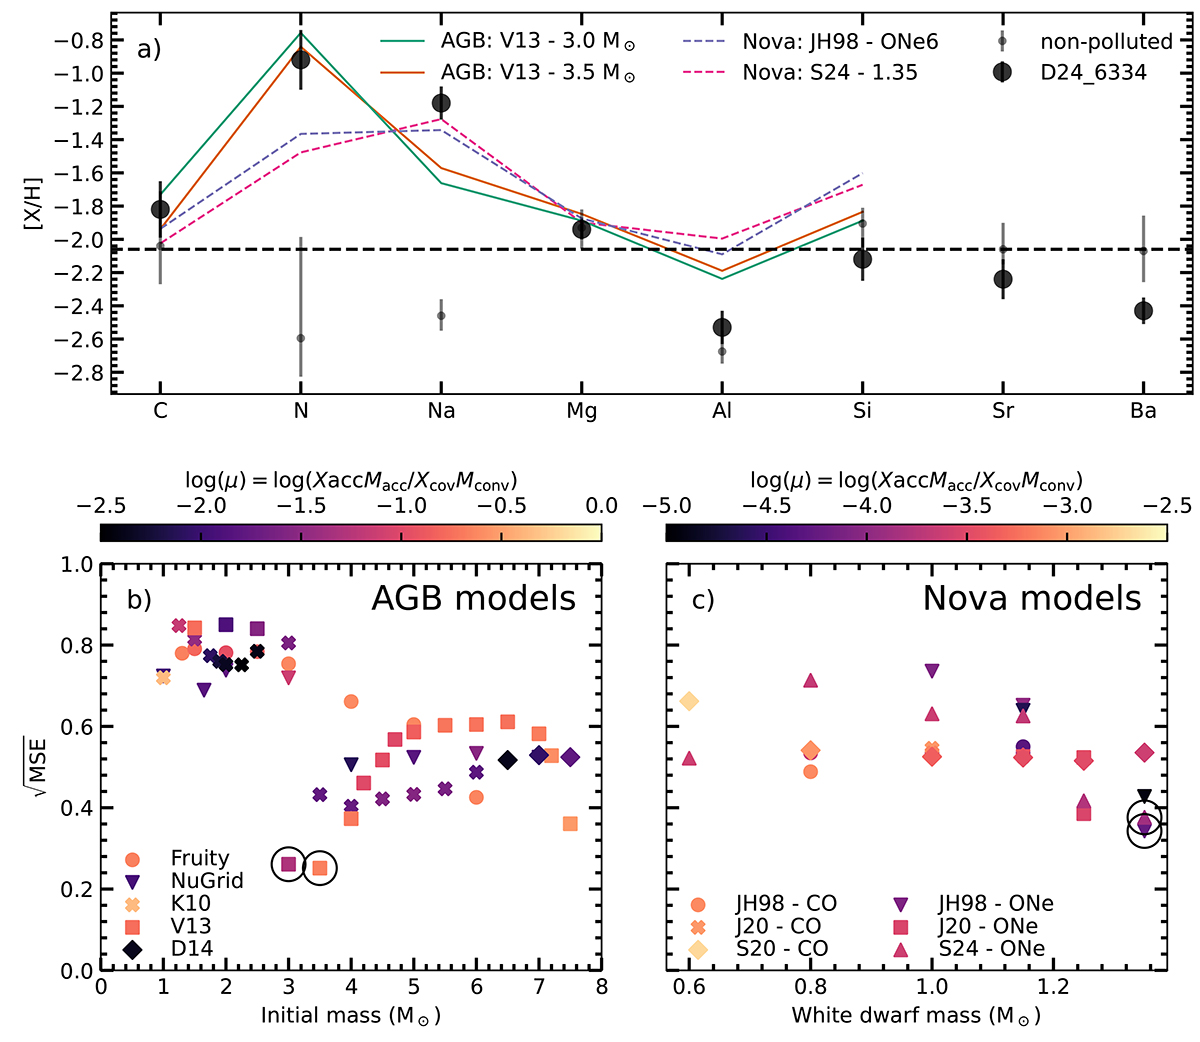
Download original image
Summary of the comparison between the observed abundance pattern of D25_6334 and the theoretical chemical yields from AGB stars and nova models. Panel a) is the same as Fig. 4 but only for four selected models. Panels b) and c) summarize the square root of the sum of the mean squared error for each model for AGB scenario (b) and for nova scenario (c). The color indicates the dilution factor, defined as the ratio of the hydrogen mass of accretion origin to the total hydrogen mass in the envelope after the accretion (see text). The four models selected in panel a) are highlighted with open circles. They are the 3.0 M⊙ and 3.5 M⊙ AGB models from Ventura et al. (2013), the “ONe6” nova model from José & Hernanz (1998), and the 1.35 M⊙ nova model from Starrfield et al. (2024).
Current usage metrics show cumulative count of Article Views (full-text article views including HTML views, PDF and ePub downloads, according to the available data) and Abstracts Views on Vision4Press platform.
Data correspond to usage on the plateform after 2015. The current usage metrics is available 48-96 hours after online publication and is updated daily on week days.
Initial download of the metrics may take a while.