Fig. 9.
Download original image
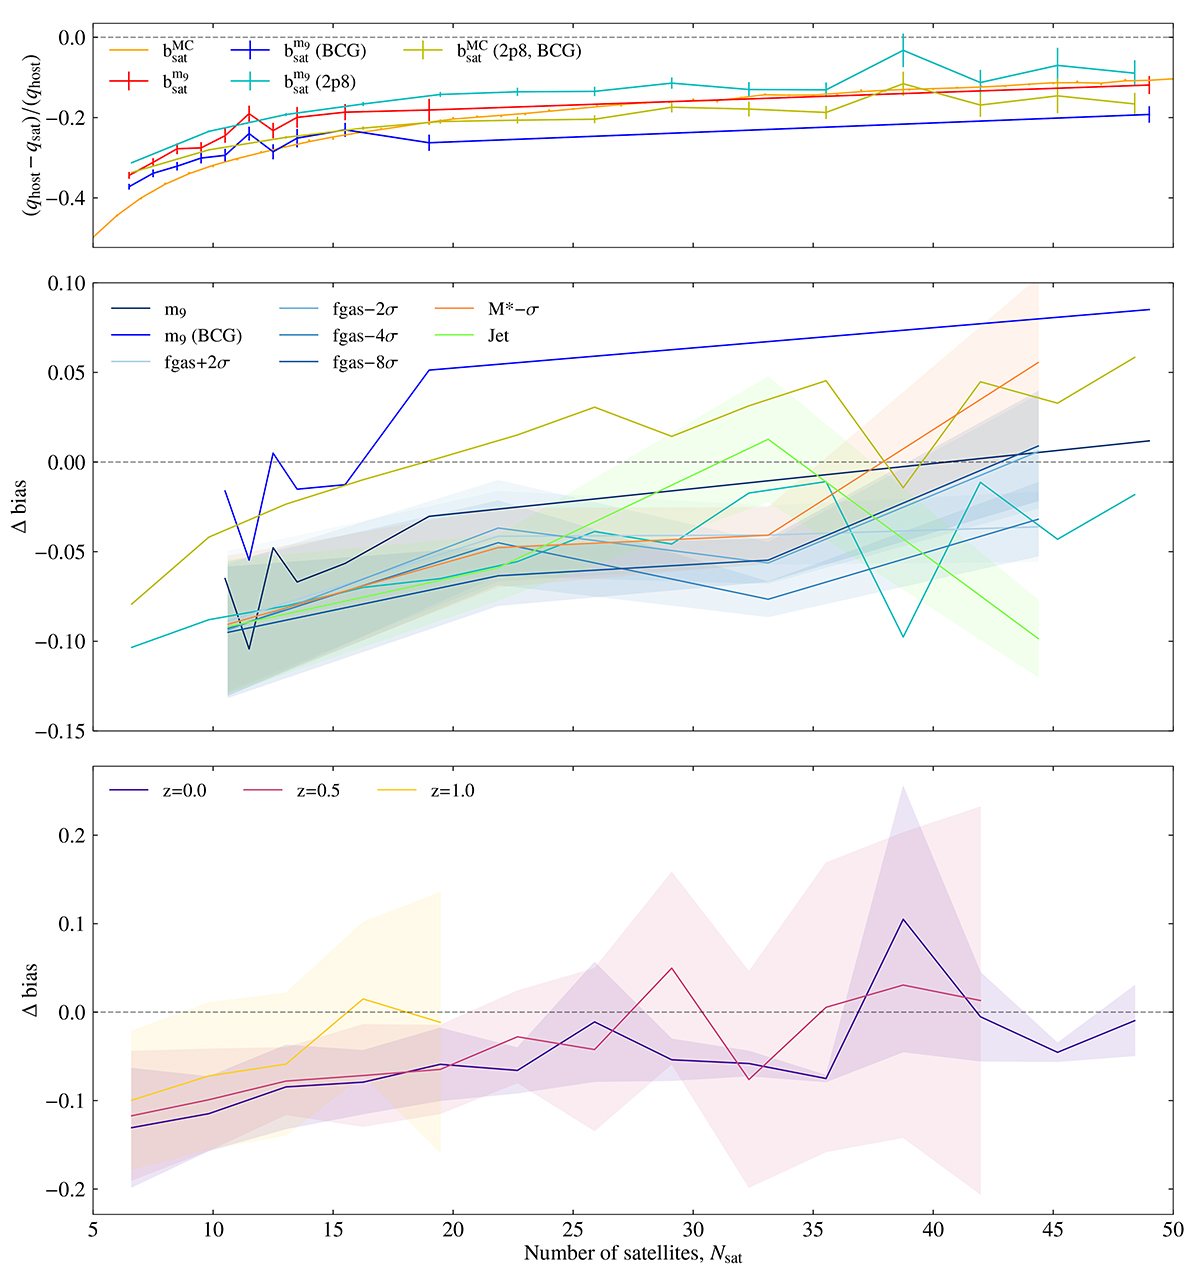
Top panel: Variation of the median projected axis ratio bias with number of satellites. We compare the bias estimate from the MC with the actual bias from measuring shapes with satellites in the m9 case. Here the bias is defined as (qhost−qsat)/qhost where qhost is the axis ratio of the host DM halo and qsat is that measured using the distribution of satellite galaxies. ![]() denotes the bias when using the satellite positions to estimate the shape of the halo for the m9 run, whereas
denotes the bias when using the satellite positions to estimate the shape of the halo for the m9 run, whereas ![]() (BCG) denotes the case where the BCG is assumed to be the centre of the shape. 2p8 refers to the 2.8 Gpc box. The middle panel shows the deviation of the estimated bias from the MC exercise for the different hydrodynamic variations. Δ bias=bMC−bsat, and the error bars (shown by the shaded regions) are estimated using the jack-knife technique using 27 sub-boxes. The bottom panel shows the deviation from the MC exercise at different redshifts for the 2.8 Gpc run. The error bars are estimated by averaging results from eight sub-boxes.
(BCG) denotes the case where the BCG is assumed to be the centre of the shape. 2p8 refers to the 2.8 Gpc box. The middle panel shows the deviation of the estimated bias from the MC exercise for the different hydrodynamic variations. Δ bias=bMC−bsat, and the error bars (shown by the shaded regions) are estimated using the jack-knife technique using 27 sub-boxes. The bottom panel shows the deviation from the MC exercise at different redshifts for the 2.8 Gpc run. The error bars are estimated by averaging results from eight sub-boxes.
Current usage metrics show cumulative count of Article Views (full-text article views including HTML views, PDF and ePub downloads, according to the available data) and Abstracts Views on Vision4Press platform.
Data correspond to usage on the plateform after 2015. The current usage metrics is available 48-96 hours after online publication and is updated daily on week days.
Initial download of the metrics may take a while.