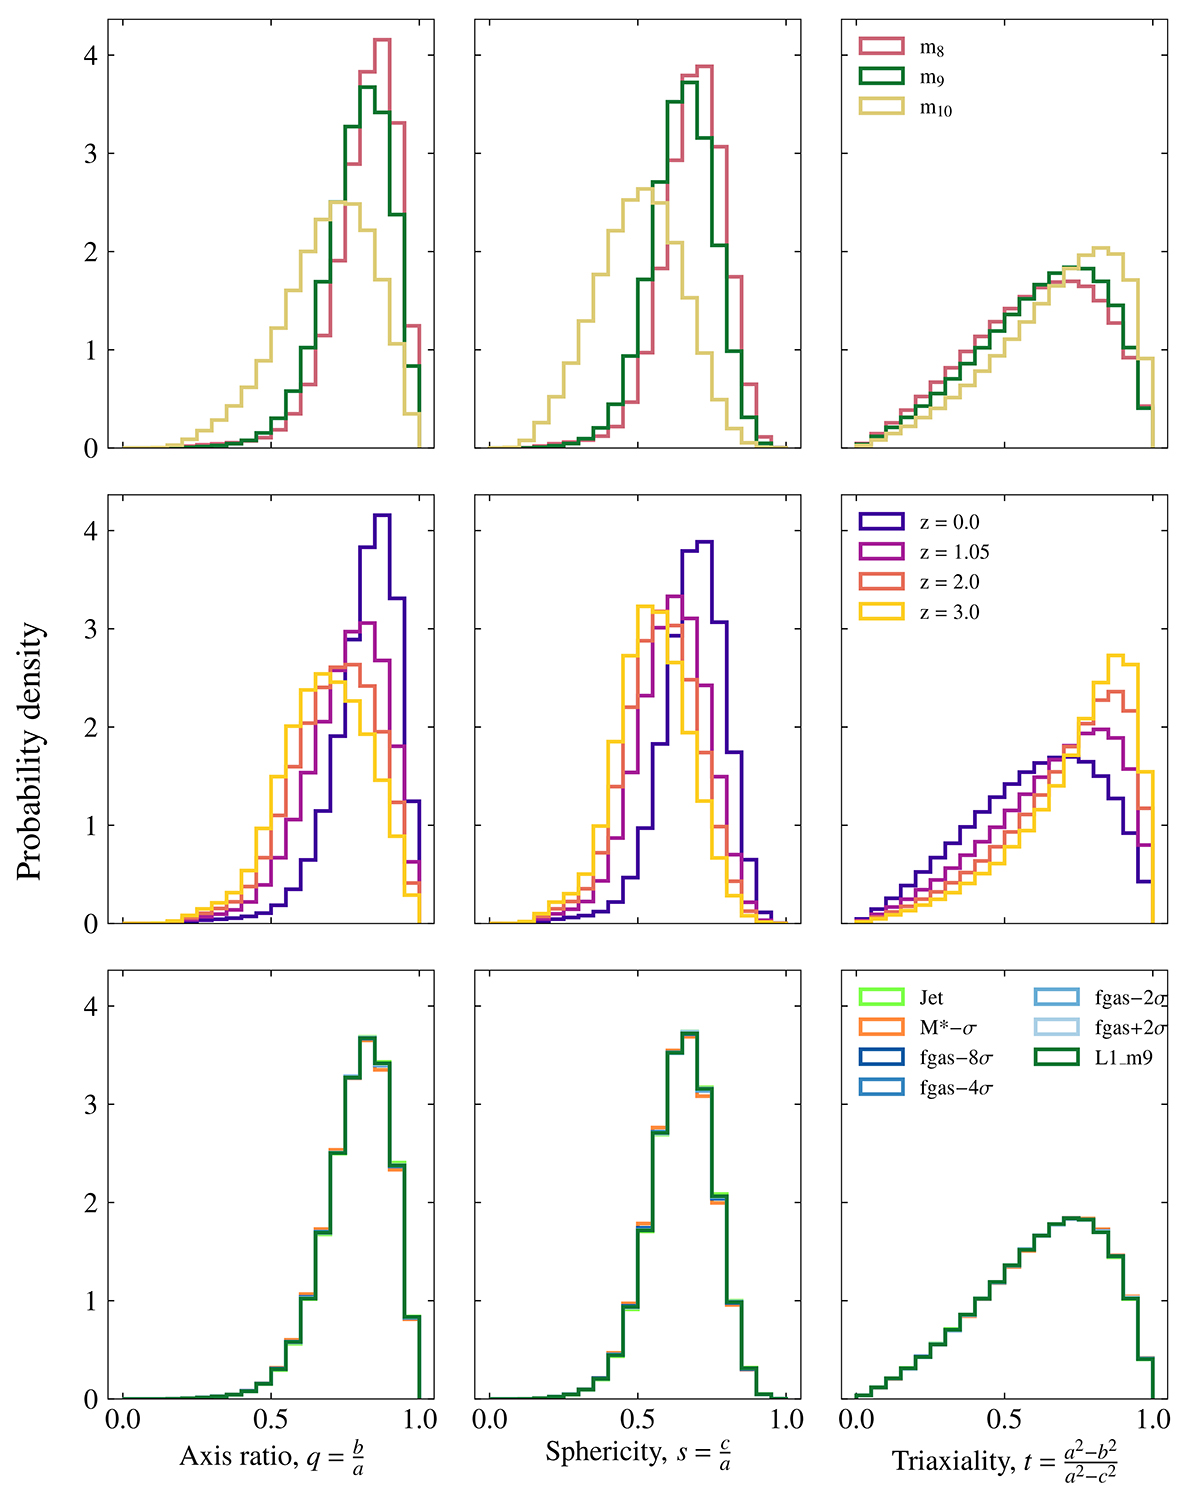
Fig. 3.
Download original image
Distributions of 3D axis ratio (q), sphericity (s) and triaxiality (t) for the dark matter of haloes with dark matter mass (bound) more than 1012 M⊙. Top panel: For the three resolutions of the simulation used. Middle panel: For the highest resolution run used in this work (m8) across redshift. Bottom panel: For the different feedback models implemented at intermediate resolution. Shapes from the m9 are reasonably well converged, whereas the m10 is less reliable. Halo shapes vary significantly with redshift. There is no strong variation with feedback variation. Mean values are shown in Table 2.
Current usage metrics show cumulative count of Article Views (full-text article views including HTML views, PDF and ePub downloads, according to the available data) and Abstracts Views on Vision4Press platform.
Data correspond to usage on the plateform after 2015. The current usage metrics is available 48-96 hours after online publication and is updated daily on week days.
Initial download of the metrics may take a while.