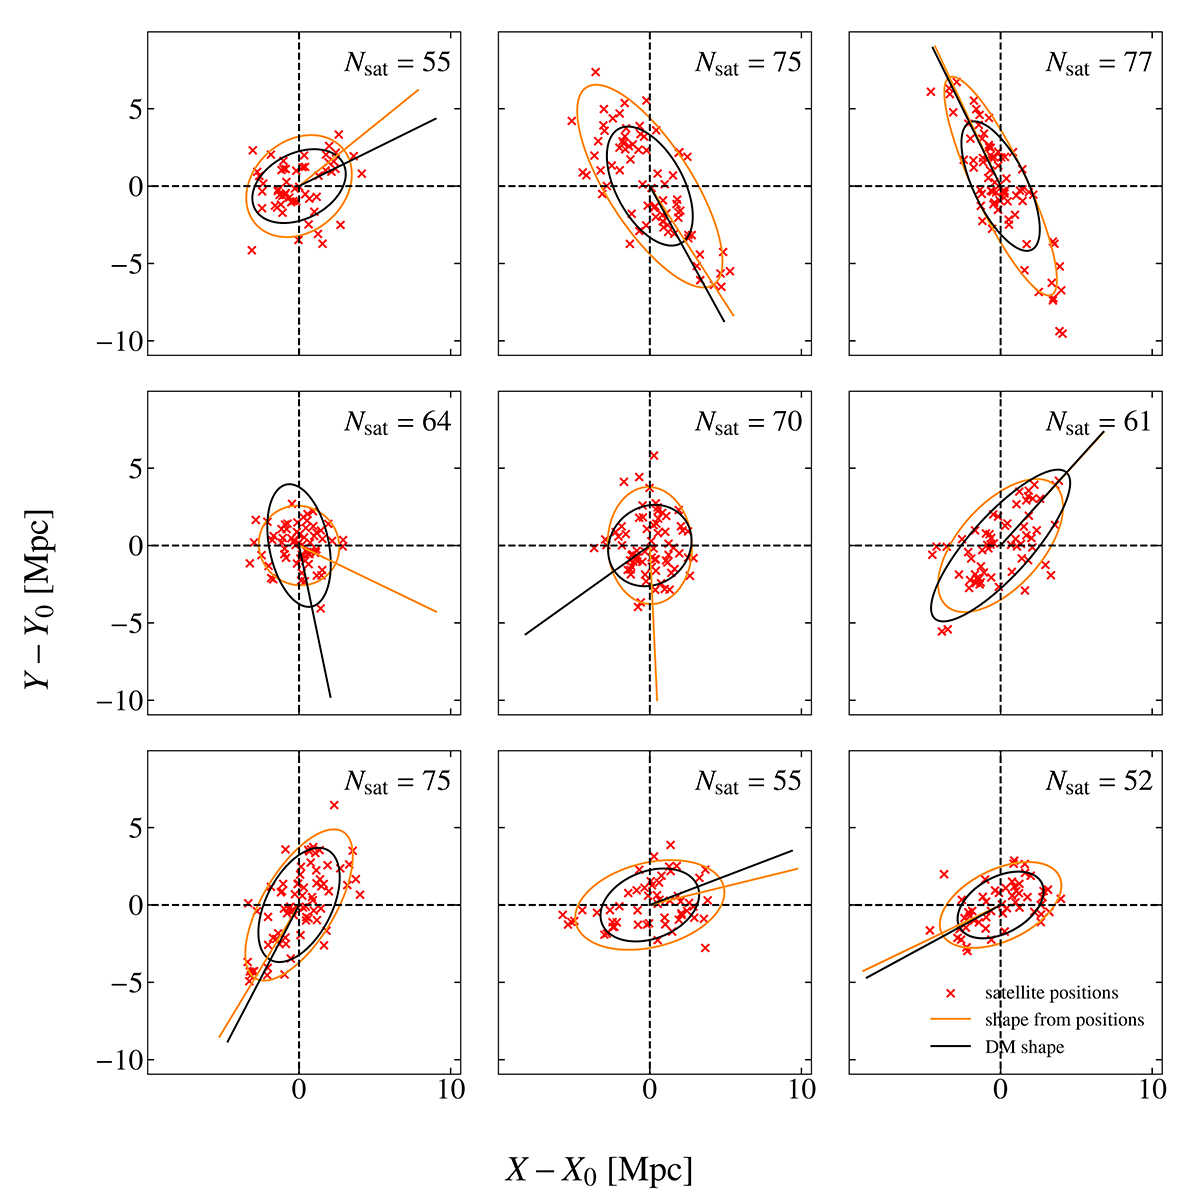
Fig. 2.
Download original image
Examples of haloes from the m9 simulation with more than 50 satellite galaxies (with bound dark matter mass in the range 1.3 to 2.4×10¹⁵ M⊙). The red crosses denote the positions of galaxies with the ellipse calculated using these positions shown in orange. The black ellipse is the corresponding dark matter ellipse. The lines show the orientation angles of the ellipses. All ellipses shown are derived from projected shapes. The positions are centred on the Centre of Potential (COP, position of the most bound particle) of the (sub)halo.
Current usage metrics show cumulative count of Article Views (full-text article views including HTML views, PDF and ePub downloads, according to the available data) and Abstracts Views on Vision4Press platform.
Data correspond to usage on the plateform after 2015. The current usage metrics is available 48-96 hours after online publication and is updated daily on week days.
Initial download of the metrics may take a while.