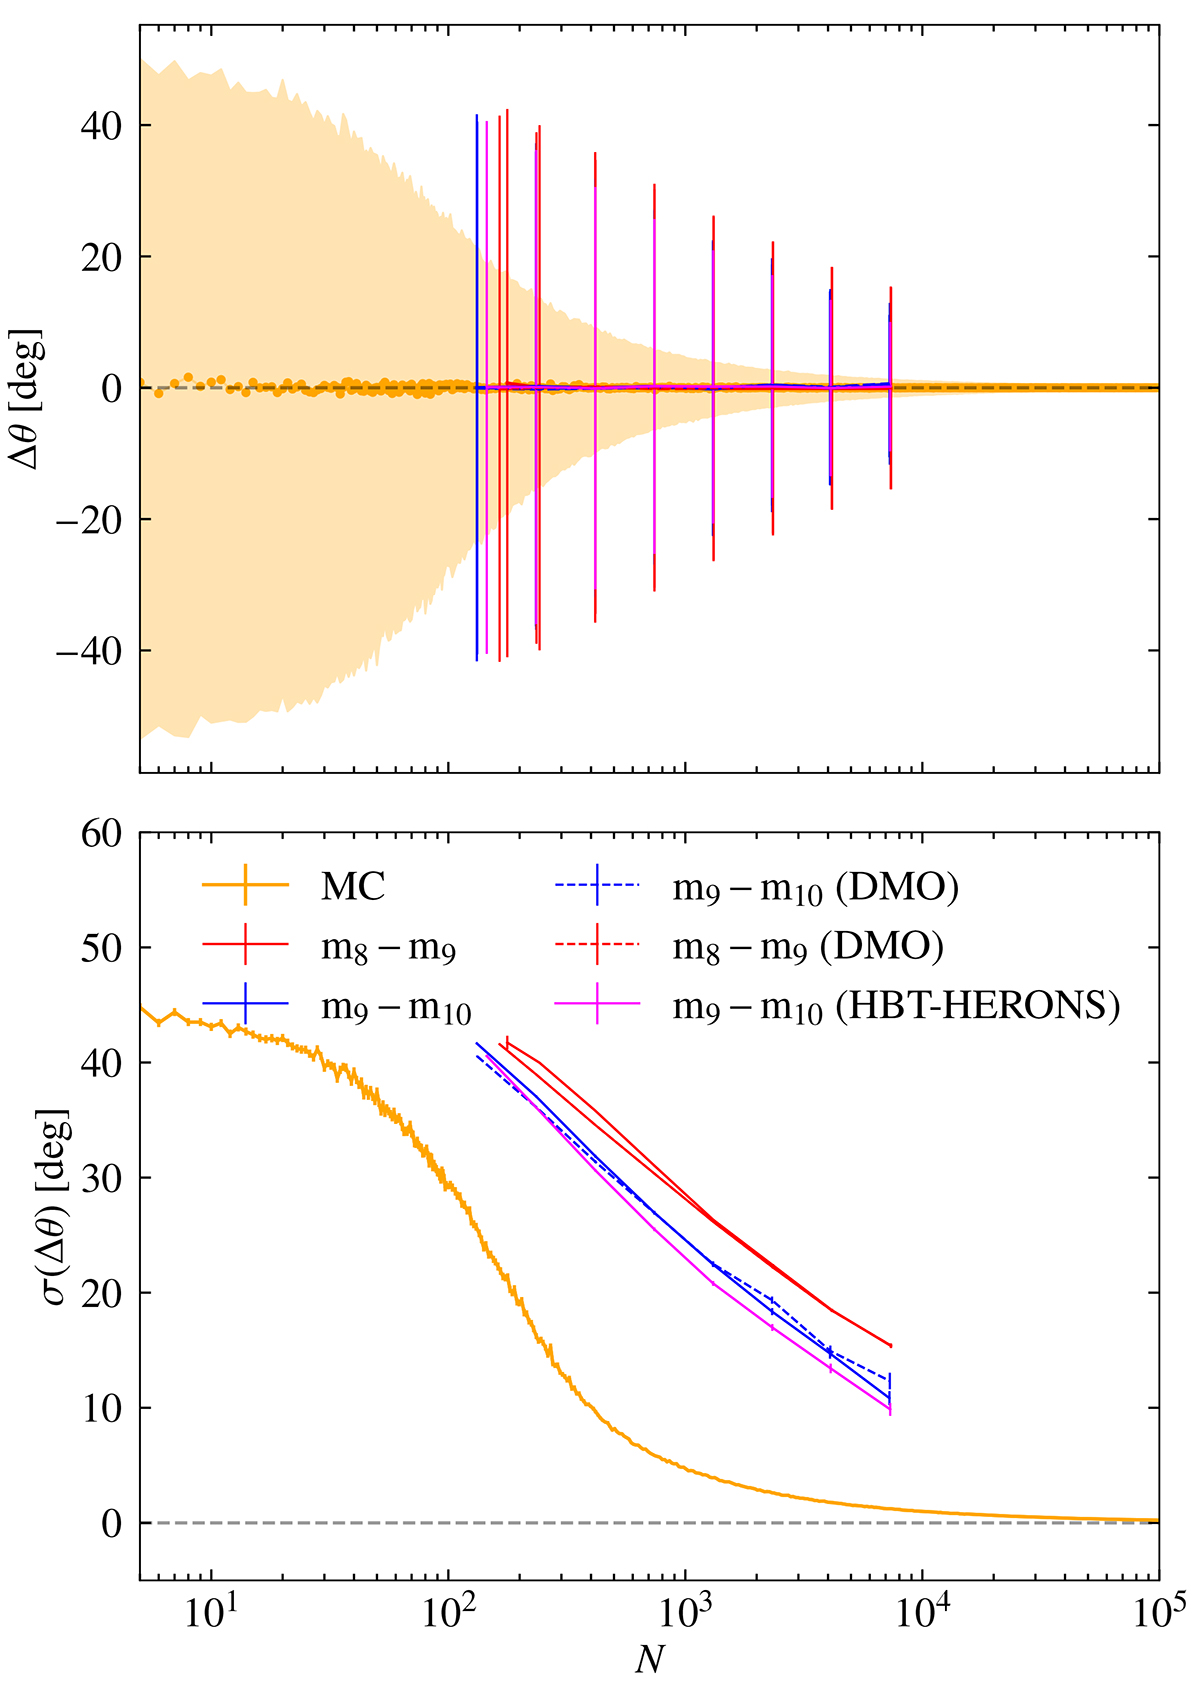
Fig. B.1.
Download original image
Top panel: The distribution of the projected misalignment angle, Δθ, as a function of the number of particles. The orange points depict the prediction from the MC, assuming only sampling noise. The orange shaded region is the 1σ scatter from the MC. Over plotted with error bars are the values of Δθ from haloes matched between the m8, m9 and m10 resolution runs of the simulation. Bottom panel: The scatter of Δθ as a function of the number of particles. This is the scatter of the top panel, with the r.m.s errors calculated using bootstrapping. The scatter on the misalignment angle from the simulations are larger than our pure sampling noise model, due to the additional scatter arising when resolved low-mass substructure is excised from the host halo.
Current usage metrics show cumulative count of Article Views (full-text article views including HTML views, PDF and ePub downloads, according to the available data) and Abstracts Views on Vision4Press platform.
Data correspond to usage on the plateform after 2015. The current usage metrics is available 48-96 hours after online publication and is updated daily on week days.
Initial download of the metrics may take a while.