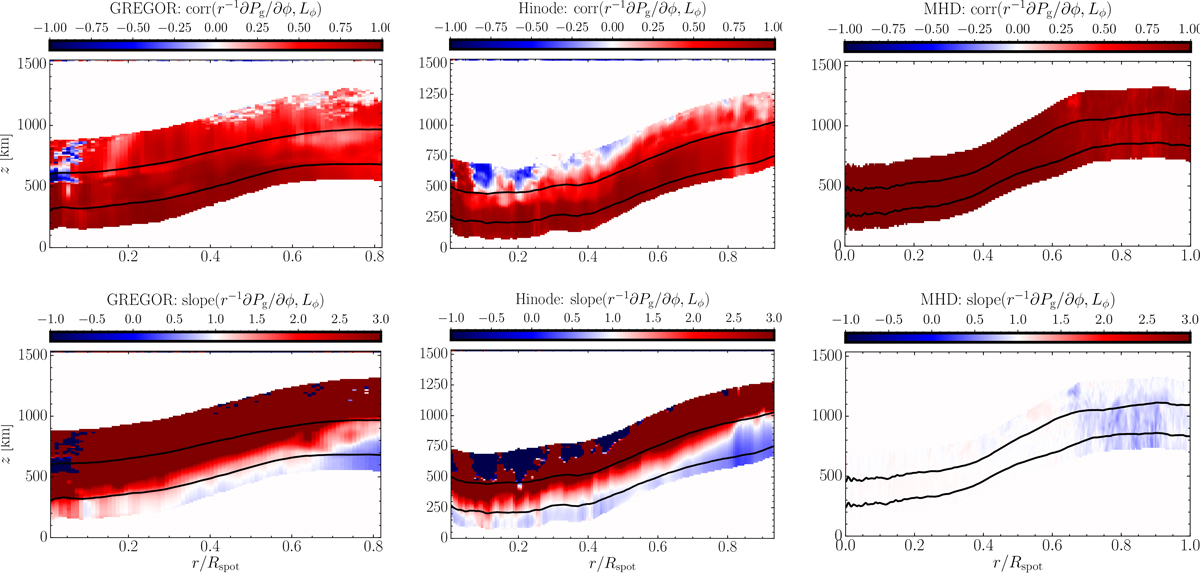
Fig. A.1.
Download original image
Study of the MHS equilibrium along the azimuthal direction for the whole sunspots. Top panels: Pearson’s correlation coefficient between the rhs and lhs of Eq. A.7 as a function of (r, z). Bottom panels: same as on the top but for the slope of the linear regression between the rhs and lhs of Eq. A.7 as a function of (r, z). Rs represents the radius of the sunspots. Solid black lines show the ϕ-average location of the τc = 1, 10−2. Observational results are displayed on the left (GREGOR) and middle (Hinode) panels. Results from the MHD simulations are presented in the rightmost panels.
Current usage metrics show cumulative count of Article Views (full-text article views including HTML views, PDF and ePub downloads, according to the available data) and Abstracts Views on Vision4Press platform.
Data correspond to usage on the plateform after 2015. The current usage metrics is available 48-96 hours after online publication and is updated daily on week days.
Initial download of the metrics may take a while.