Fig. 3.
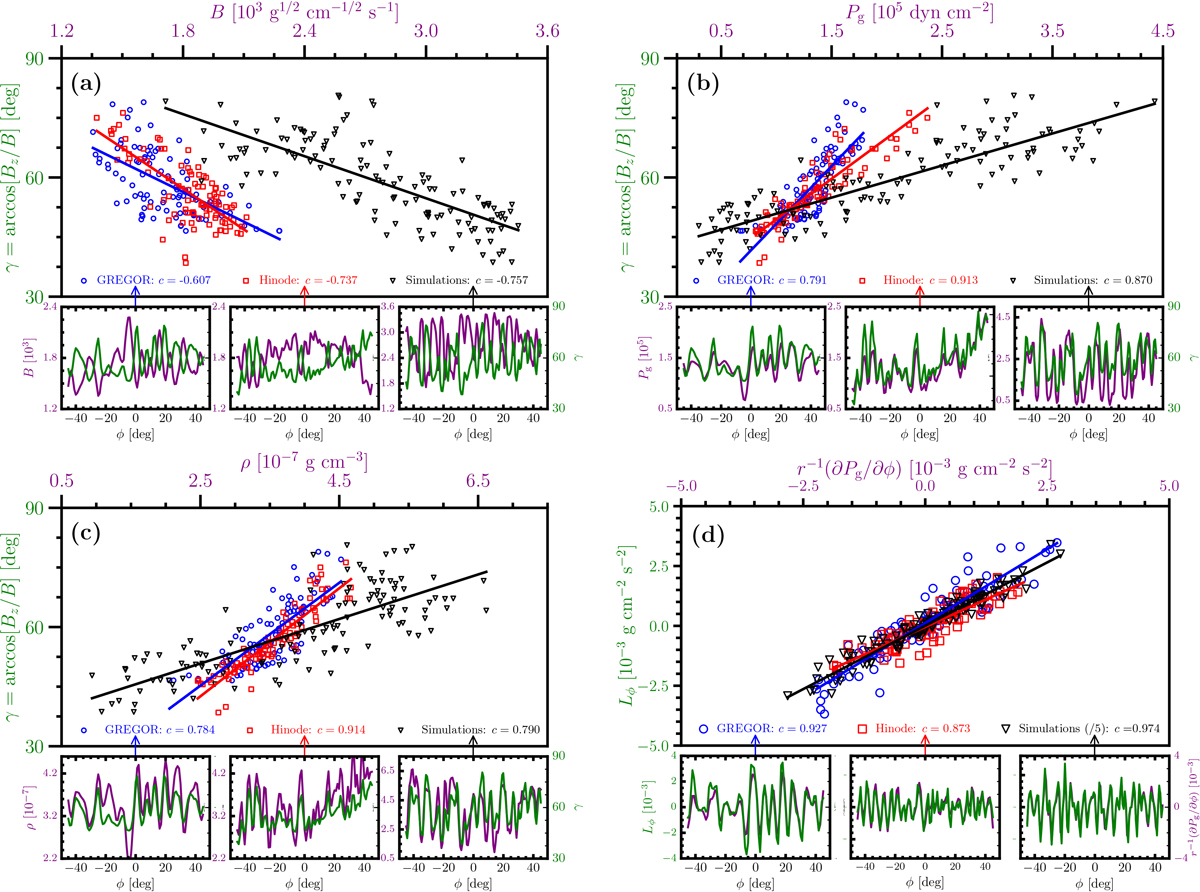
Download original image
Scatter plots of the physical quantities along the outermost azimuthal arc (i.e., penumbra) for GREGOR data (red squares), Hinode data (blue circles), and the MHD simulation (black triangles). Pearson correlations coefficients, c, for each of these pieces of data are provided in the legend. Linear fits to the data are shown with thick solid color lines. Upper left: γ − ∥B∥. Upper right: γ − Pg. Lower left: γ − ρ. Lower right: Lϕ − r−1∂Pg/∂ϕ. Each panel also includes three smaller subpanels in which the variations in the physical quantities along ϕ are displayed in purple and green colors. These subpanels are ordered as: GREGOR (left), Hinode (middle), and MHD simulations (right). This is also indicated by the arrows under the correlation coefficients for each data source. We note that the values of the ϕ components of the Lorentz force and of the gas pressure gradient in the simulations have been divided by five.
Current usage metrics show cumulative count of Article Views (full-text article views including HTML views, PDF and ePub downloads, according to the available data) and Abstracts Views on Vision4Press platform.
Data correspond to usage on the plateform after 2015. The current usage metrics is available 48-96 hours after online publication and is updated daily on week days.
Initial download of the metrics may take a while.