Fig. 2.
Download original image
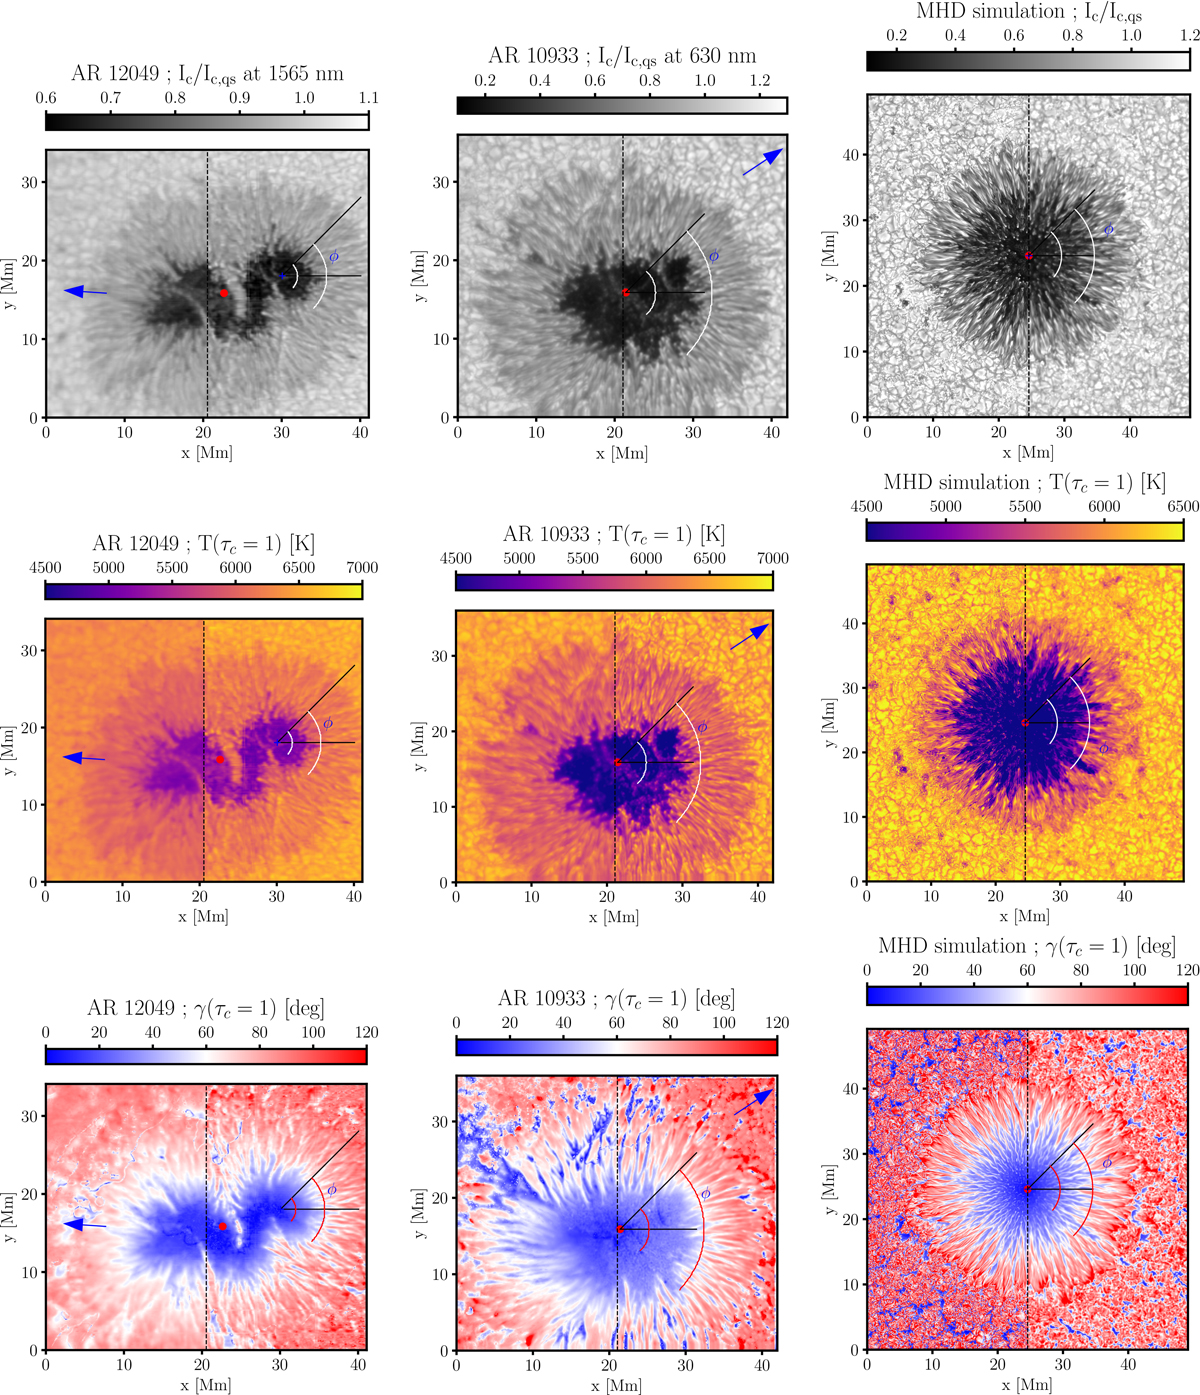
Summary of analyzed data and inversion results. Top row: Continuum intensity normalized to the average quiet Sun intensity, Ic/Ic, qs. Middle row: Temperature, T. Bottom row: Inclination of the magnetic field, γ, with respect to the normal vector to the solar surface. All values were taken at the continuum optical depth, τc = 1. Left column: Sunspot observed with the ground telescope GREGOR and data inverted with the FIRTEZ code. Middle column: Same as before but for the sunspot recorded with the Hinode satellite. Right column: Sunspot simulated with the MuRAM code. Each panel is split on two: the left side of the first two columns display the results of the pixel-wise Stokes inversion, whereas the right side presents the results of the PSF-coupled inversion. In the third column, the left side shows the simulation with the original horizontal resolution of 32 km × 32 km, while the right side shows the simulation convolved and resampled to 128 km × 128 in order to match the approximate resolution and sampling of the GREGOR and Hinode data. Each figure contains the direction of the center of the solar disk (blue arrow) and displays two azimuthal paths with a varying angle, ϕ, at a constant radial distance from the spots’ center: the outermost arc is in the penumbra, whereas the innermost arc lies in the umbra.
Current usage metrics show cumulative count of Article Views (full-text article views including HTML views, PDF and ePub downloads, according to the available data) and Abstracts Views on Vision4Press platform.
Data correspond to usage on the plateform after 2015. The current usage metrics is available 48-96 hours after online publication and is updated daily on week days.
Initial download of the metrics may take a while.