Open Access
Fig. E.1
Download original image
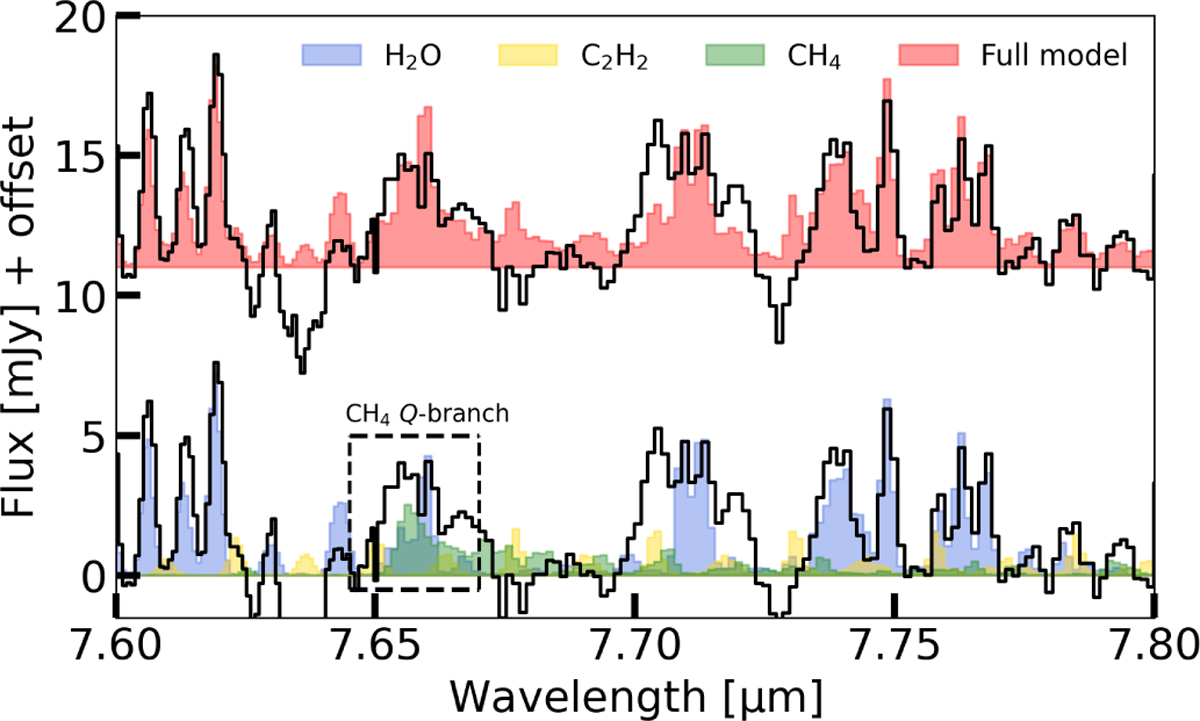
Zoom-in on the 7.60-8.00 µm region of CY Tau, showing the potential detection of CH4 (green). Also shown are approximate contributions from H2O (blue) and C2H2 (yellow) slab models. The full model is shown in red with a small offset applied to the flux.
Current usage metrics show cumulative count of Article Views (full-text article views including HTML views, PDF and ePub downloads, according to the available data) and Abstracts Views on Vision4Press platform.
Data correspond to usage on the plateform after 2015. The current usage metrics is available 48-96 hours after online publication and is updated daily on week days.
Initial download of the metrics may take a while.