Fig. 6
Download original image
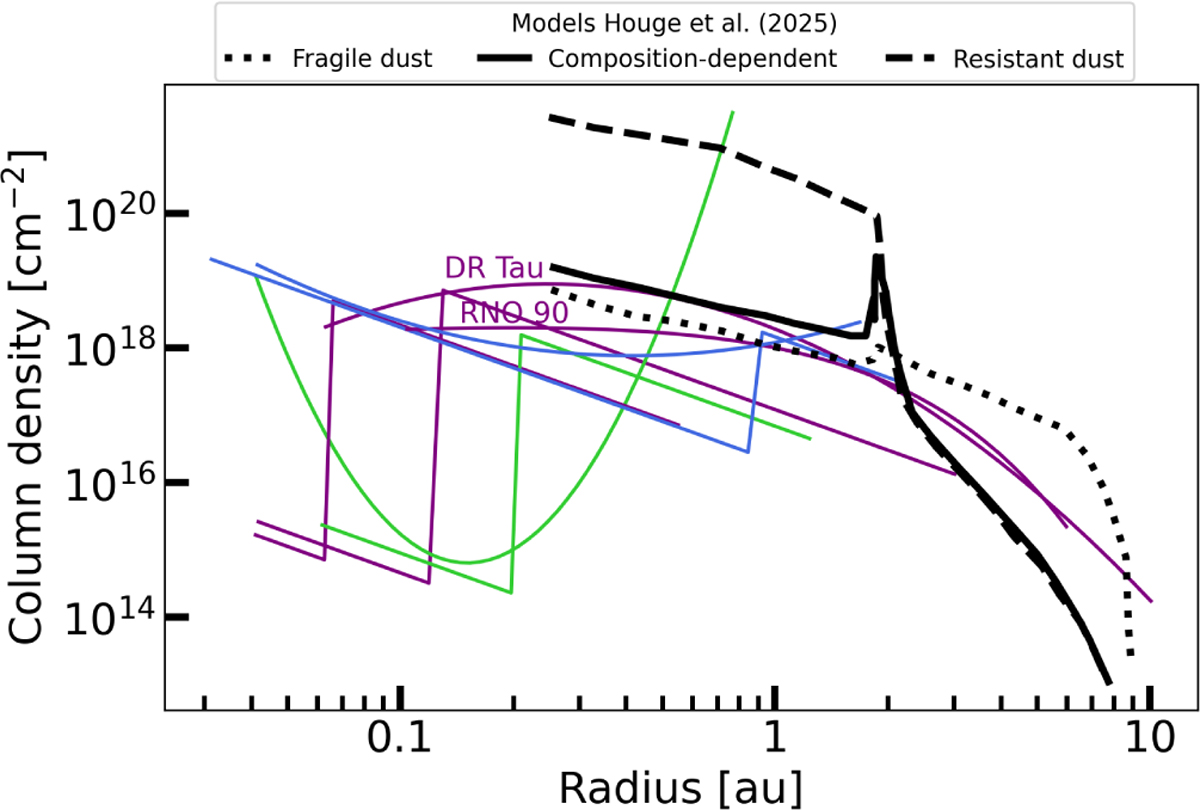
Comparisons between our parametric models with the lowest ![]() -values and the prediction from the radially varying vertical models from Houge et al. (2025) for all three tested dust types: fragile (dotted), composition-dependent (solid), and resistant (dashed). The profiles of our discs identified to be type N are shown in purple, while those of the type E and type P discs are displayed in, respectively, blue and green.
-values and the prediction from the radially varying vertical models from Houge et al. (2025) for all three tested dust types: fragile (dotted), composition-dependent (solid), and resistant (dashed). The profiles of our discs identified to be type N are shown in purple, while those of the type E and type P discs are displayed in, respectively, blue and green.
Current usage metrics show cumulative count of Article Views (full-text article views including HTML views, PDF and ePub downloads, according to the available data) and Abstracts Views on Vision4Press platform.
Data correspond to usage on the plateform after 2015. The current usage metrics is available 48-96 hours after online publication and is updated daily on week days.
Initial download of the metrics may take a while.