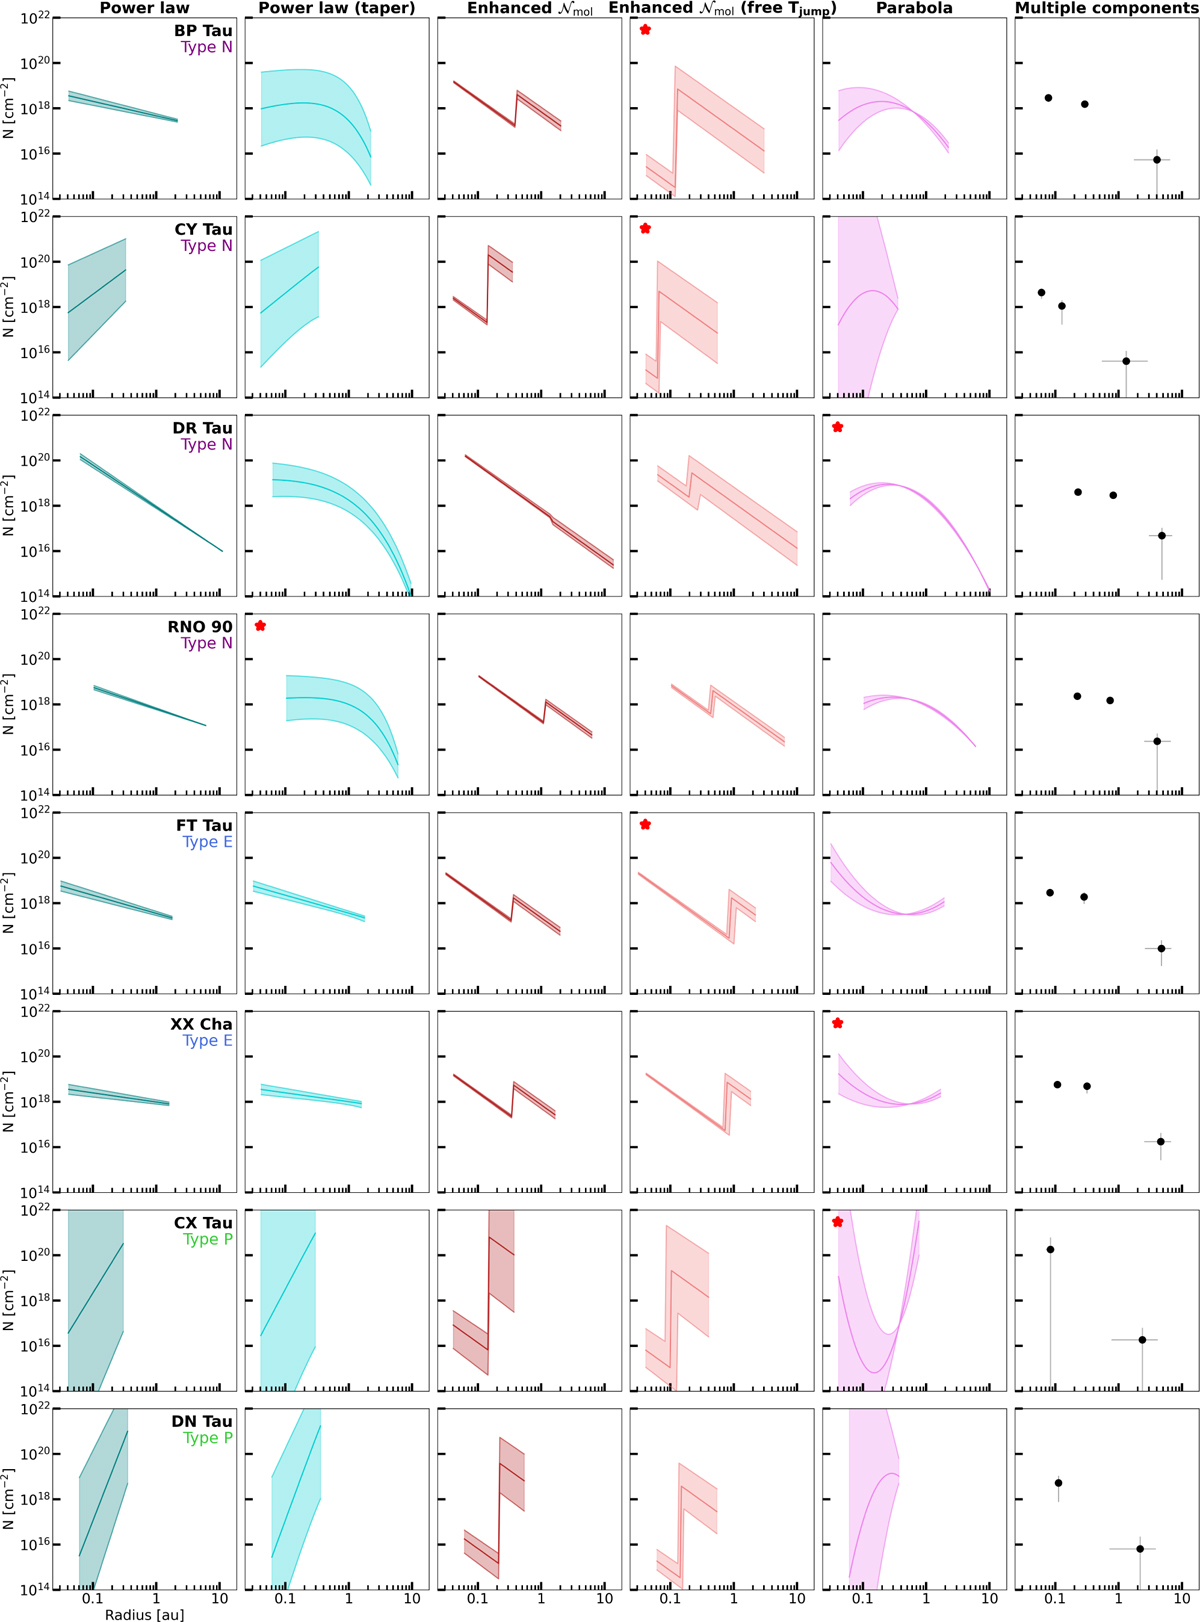
Fig. 3
Download original image
Profiles and multiple components (right-most panel) fitted for our sample of compact discs using a line width of 4.71 km s−1. The shaded area is the 1σ-confidence interval, given the uncertainties listed in Table D.2. The red stars in the top-left corner indicate the best fitting profiles for each disc (see Table D.1). We note that the best-fitting profile for DN Tau is highlighted in Figure D.1.
Current usage metrics show cumulative count of Article Views (full-text article views including HTML views, PDF and ePub downloads, according to the available data) and Abstracts Views on Vision4Press platform.
Data correspond to usage on the plateform after 2015. The current usage metrics is available 48-96 hours after online publication and is updated daily on week days.
Initial download of the metrics may take a while.