Open Access
Fig. 2
Download original image
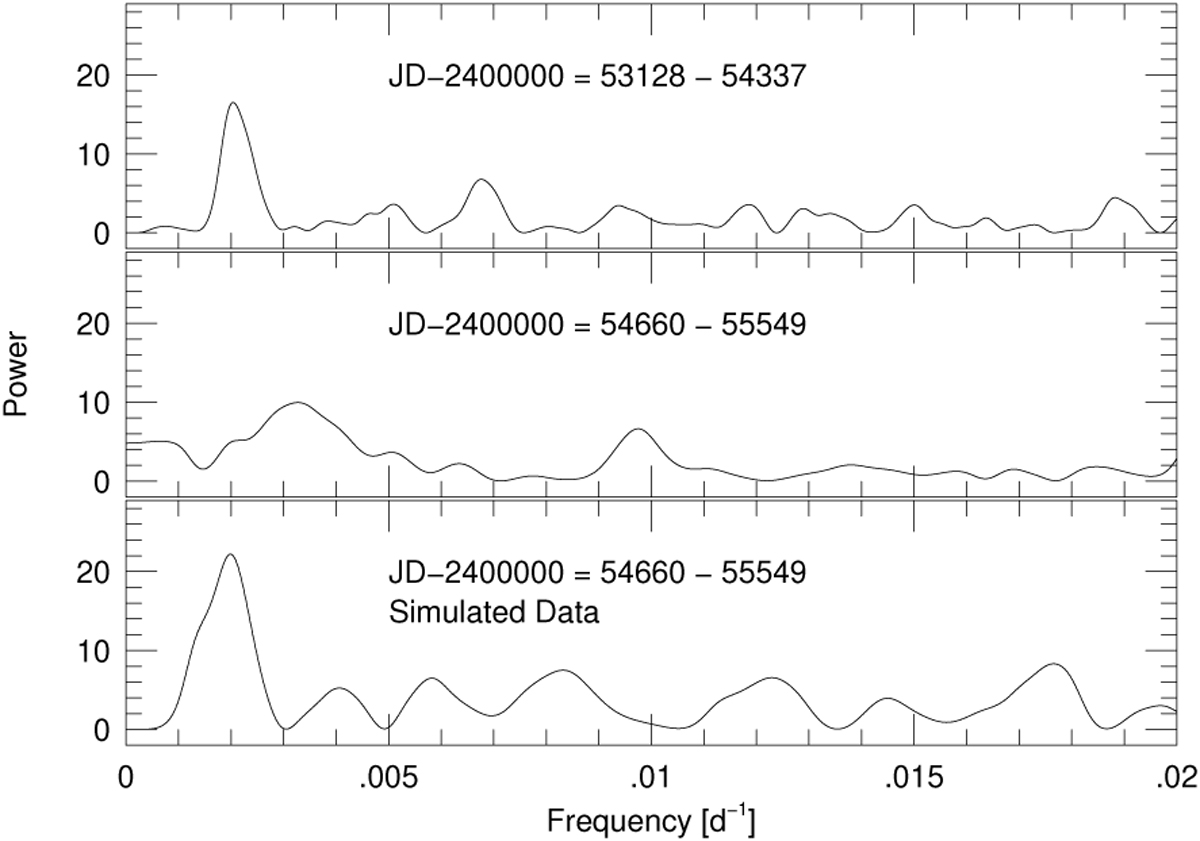
(Top) Lomb–Scargle periodogram of RV measurements up to JD = 2 454 337. (Middle) Periodogram of RV measurements taken after JD ≈ 2 454 660. (Bottom) Periodogram of a simulated orbit over the same time range as the middle panel. The 479-d period should have been present in the periodogram of the latter RV measurements.
Current usage metrics show cumulative count of Article Views (full-text article views including HTML views, PDF and ePub downloads, according to the available data) and Abstracts Views on Vision4Press platform.
Data correspond to usage on the plateform after 2015. The current usage metrics is available 48-96 hours after online publication and is updated daily on week days.
Initial download of the metrics may take a while.