Fig. 5
Download original image
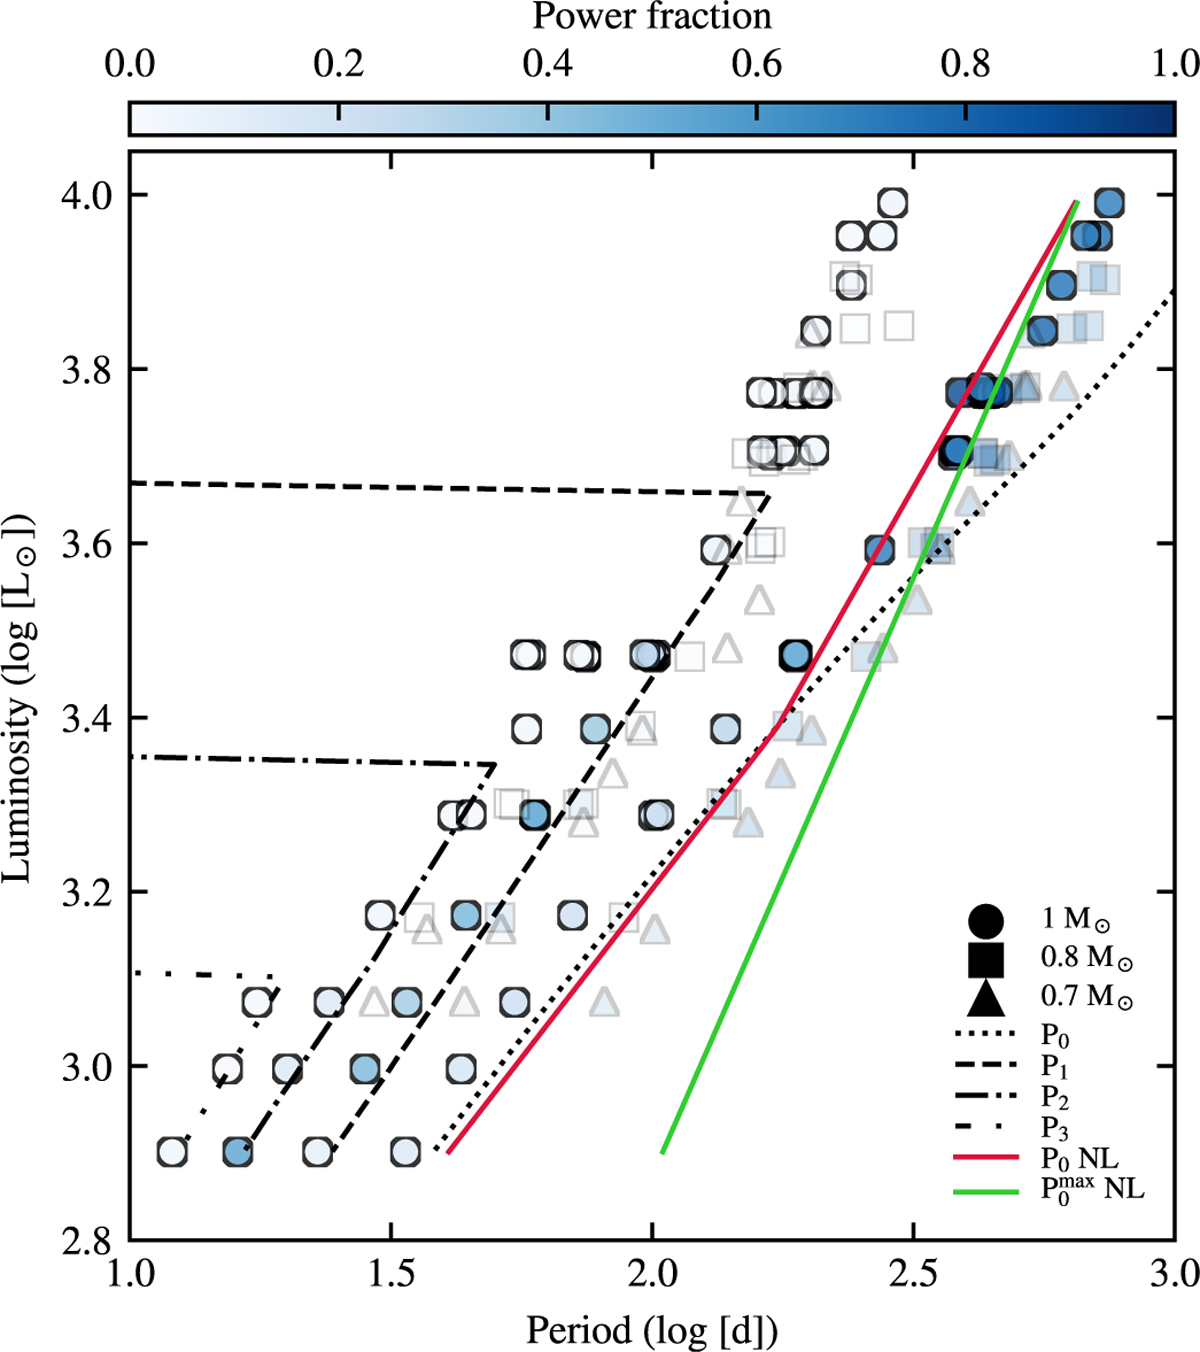
The derived P-L relation, where the colour represents the fraction of power in the power spectra, derived from the FFT of the radial velocity, on the stellar surface for each identified mode in the models. Data points for 0.7 and 0.8 M⊙ models are faded to emphasise the 1 M⊙ models. The lines with different patterns correspond to the linear fundamental and first-, second-, and third-overtone periods (P0, P1, P2 and P3, respectively) interpolated from Trabucchi et al. (2019). The non-linear fundamental period and its maximum limit (respectively P0 NL and ![]() NL) follows the analytical formulae derived from Trabucchi et al. (2021).
NL) follows the analytical formulae derived from Trabucchi et al. (2021).
Current usage metrics show cumulative count of Article Views (full-text article views including HTML views, PDF and ePub downloads, according to the available data) and Abstracts Views on Vision4Press platform.
Data correspond to usage on the plateform after 2015. The current usage metrics is available 48-96 hours after online publication and is updated daily on week days.
Initial download of the metrics may take a while.