Fig. 10
Download original image
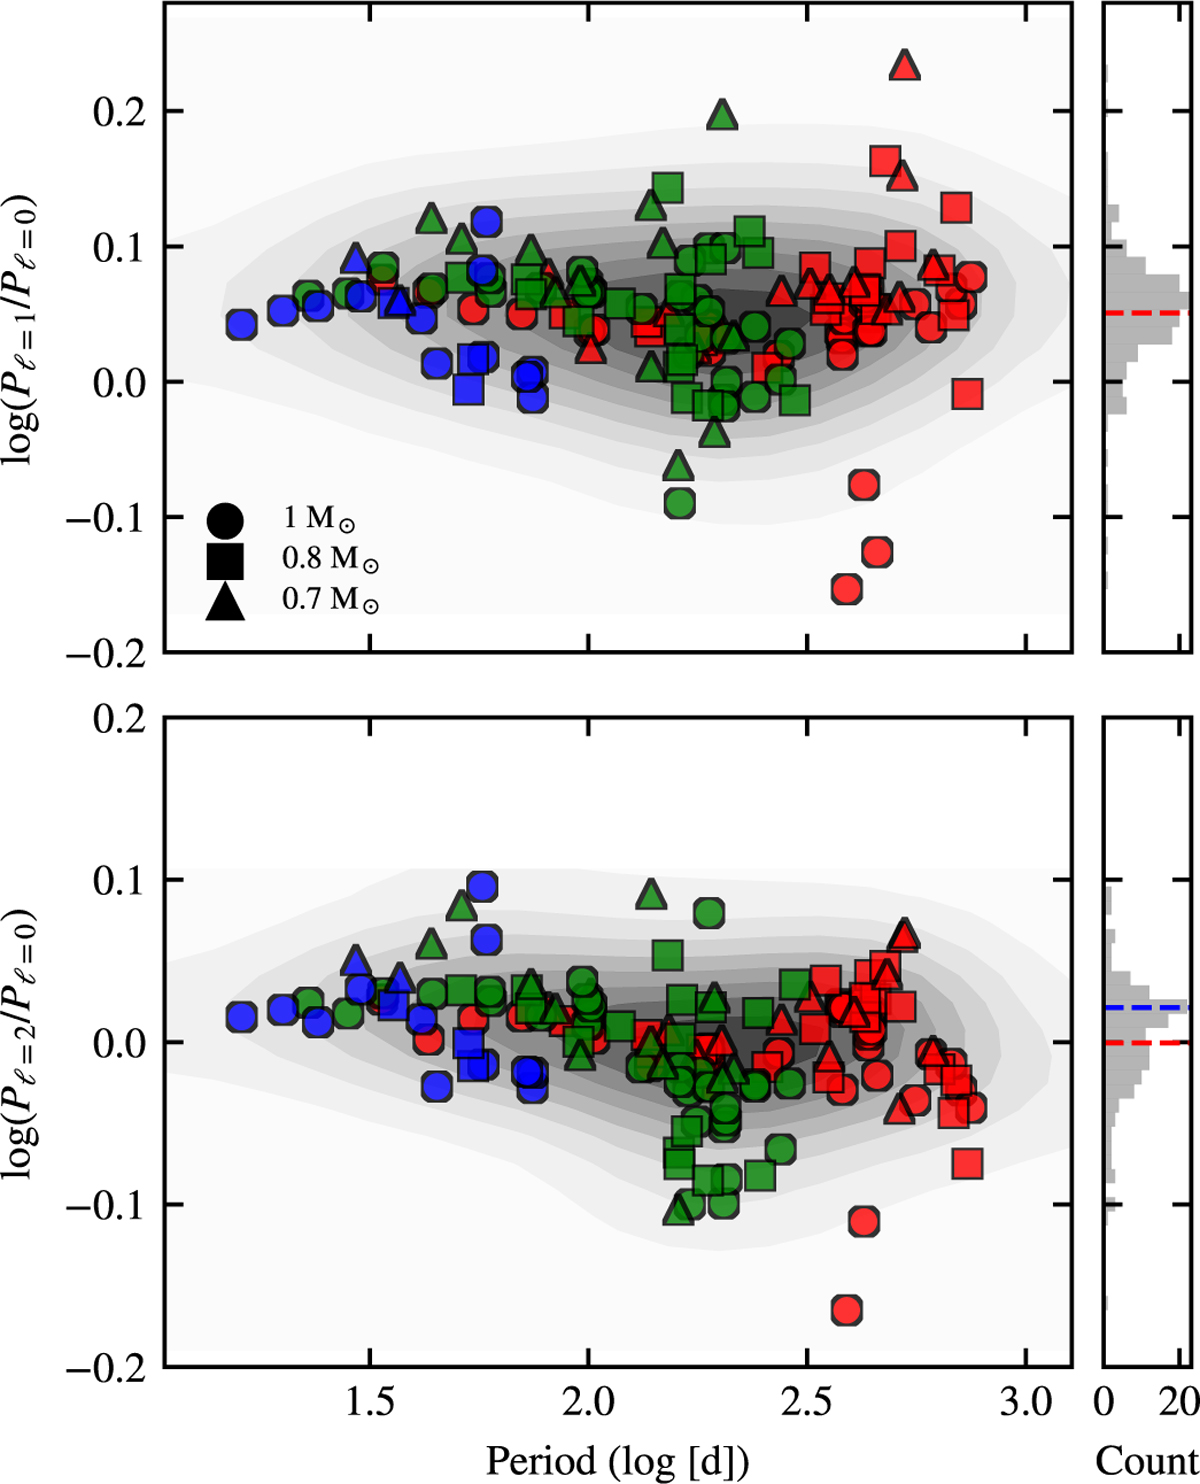
Comparison of derived pulsation periods for different degrees. Top panel: Logarithmic ratio of periods derived from ℓ=2 and ℓ=0. Bottom panel: Logarithmic ratio of periods derived from ℓ=1 and ℓ= 0. The colours indicate pulsation modes in the fundamental, first and second overtones, represented by red, green, and blue, respectively. The contours in each main panel illustrates the data point distribution. The subpanels in each row show histograms of the ratios, with dashed lines marking the mean values. For the bottom panel, the dashed blue line in the histogram represents the mean ratio when a luminosity criterion of log(L*[L⊙]) ≤ 3.5 is applied to the models being considered for the corresponding ratio results.
Current usage metrics show cumulative count of Article Views (full-text article views including HTML views, PDF and ePub downloads, according to the available data) and Abstracts Views on Vision4Press platform.
Data correspond to usage on the plateform after 2015. The current usage metrics is available 48-96 hours after online publication and is updated daily on week days.
Initial download of the metrics may take a while.