Fig. 1
Download original image
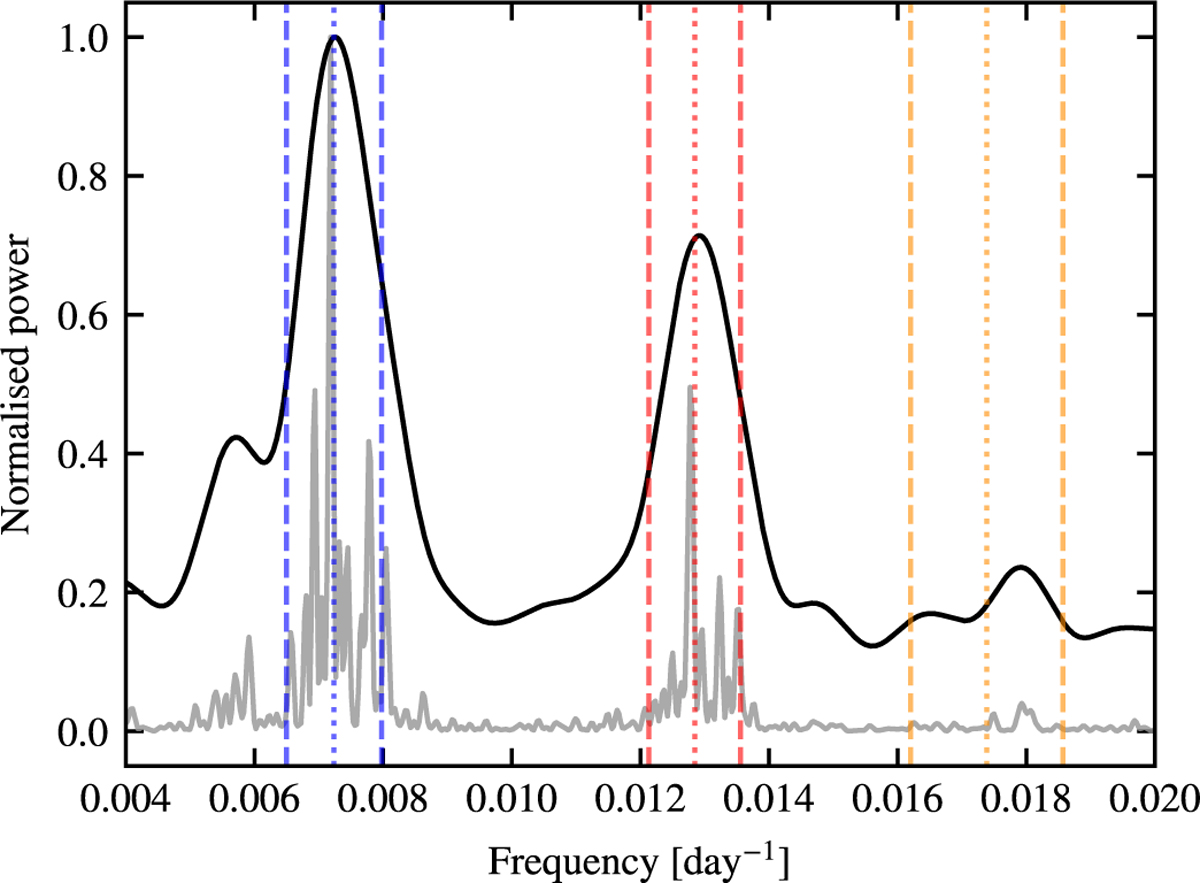
Power spectrum of the spherically averaged radial velocity for model C. The grey curve shows the averaged power spectrum (normalised so that its maximum is unity) of the spherically averaged radial velocity, computed over the radial range 80−100% of R*. The black curve shows the same signal after applying the two-step smoothing procedure (Savitzky-Golay followed by Gaussian filtering), demonstrating the effectiveness of the method in reducing noise while preserving peak structure. Vertical dotted and dashed lines indicate the derived fmean values and their corresponding bounds fmean ± fRMS for the fundamental, first overtone, and second overtone modes, shown in blue, red, and orange, respectively. See main text for further details.
Current usage metrics show cumulative count of Article Views (full-text article views including HTML views, PDF and ePub downloads, according to the available data) and Abstracts Views on Vision4Press platform.
Data correspond to usage on the plateform after 2015. The current usage metrics is available 48-96 hours after online publication and is updated daily on week days.
Initial download of the metrics may take a while.