Fig. C.1.
Download original image
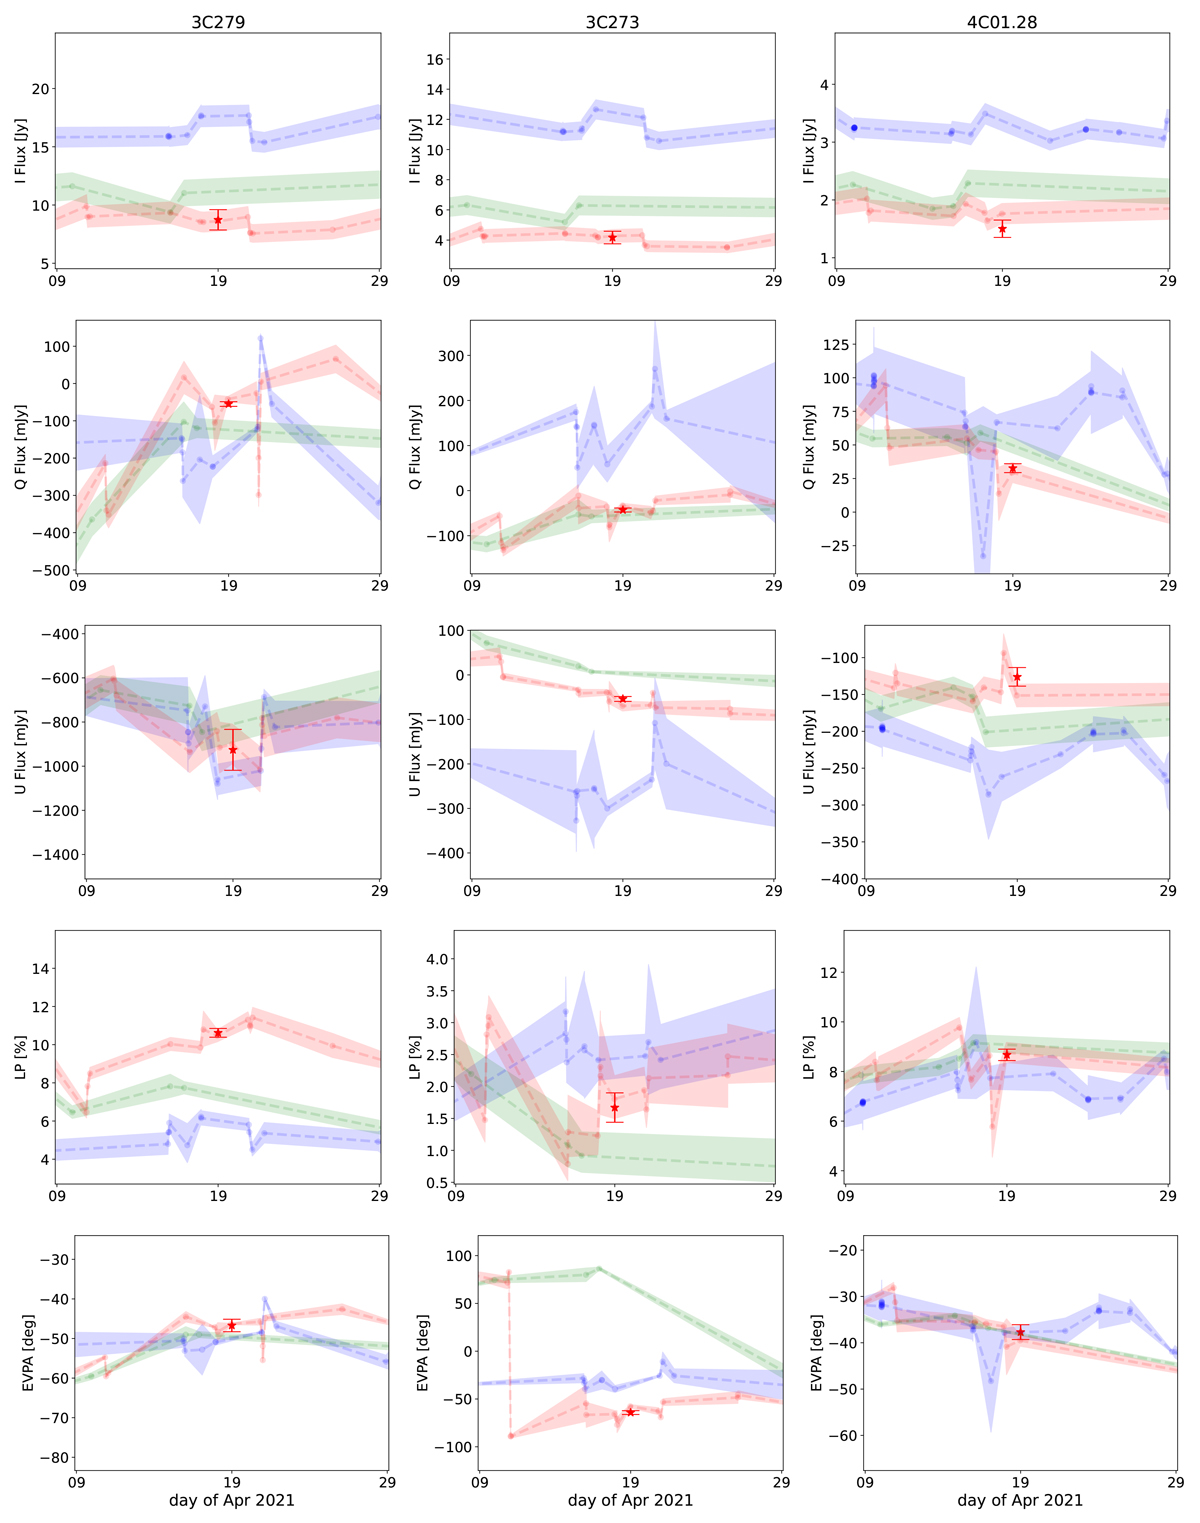
Comparison of the polarimetric results obtained for all sources observed in VLBI mode on April 19, 2021, with those retrieved from the AMAPOLA polarimetric analysis of GS data. Each row shows a specific parameter (from top to bottom: Stokes I, Q, U, LP, and EVPA), while each column corresponds to a different source (labels in the top panel; see also Fig. C.2 for more sources). The measurements from the ALMA-VLBI observations are indicated as red stars with associated error bars. The shaded regions correspond to AMAPOLA's ±1σ uncertainties for Band 3 (97.5 GHz; blue shading), Band 6 (221.1 GHz; green shading), and Band 7 (343.4 GHz; red shading). These uncertainties are derived from the ACA GS data, while their temporal evolution (lines) is interpolated between individual GS measurements. This figure and Fig. C.2 highlight that, for most cases, the ALMA-VLBI measurements agree well with the AMAPOLA trends, helping confirm the reliability of the polarization calibration across bands.
Current usage metrics show cumulative count of Article Views (full-text article views including HTML views, PDF and ePub downloads, according to the available data) and Abstracts Views on Vision4Press platform.
Data correspond to usage on the plateform after 2015. The current usage metrics is available 48-96 hours after online publication and is updated daily on week days.
Initial download of the metrics may take a while.