Fig. 2.
Download original image
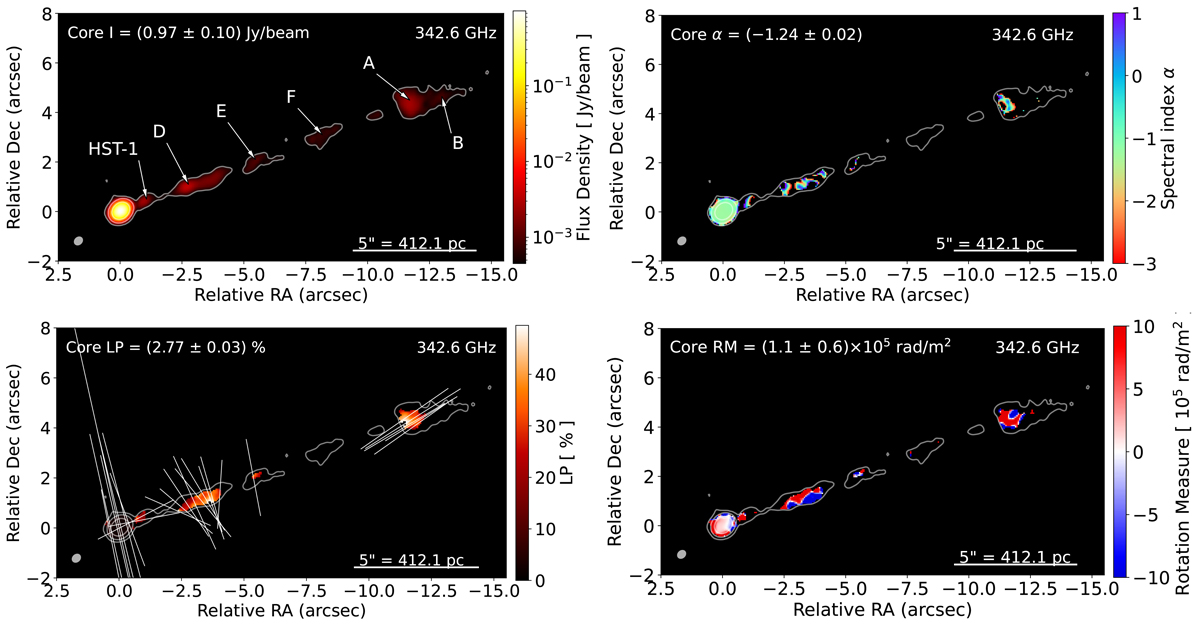
Polarization images of M87 at λ0.87 mm observed on April 19, 2021. The raster images in each panel cover an area of ≈1.5×0.8 kpc and display the following: total intensity, spectral index, fractional LP, and Faraday RM (from the top left to bottom right). White vectors overlaid in the LP panel (bottom left) represent the orientation of the EVPAs, with vector lengths linearly proportional to the polarized intensity. In each panel, the white contour corresponds to the 4σI level, where σI = 0.11 mJy/beam is the RMS noise in the Stokes I map. The total intensity brightness is plotted using a logarithmic scale starting at the 3σ level. For the spectral index map, we applied a threshold of 5×σ in Stokes I. For the LP fraction and RM maps, thresholds are defined as 3×σI for Stokes I and 2×σIp for the polarized flux density (here the σIp = 0.08 mJy/beam includes the thermal noise and the systematic error from Stokes I leakage into Stokes Q and U, combined in quadrature). The total intensity, spectral index, LP fraction, and RM values at the peak of the compact core are annotated in the upper-left corner of each panel. EVPAs are sampled every six pixels for clarity. The synthesized beam, represented as an ellipse in the lower-left corner of each panel, measures 0![]() 40 × 0
40 × 0![]() 32 at a position angle of −48°. Note that no primary beam correction is applied to these maps.
32 at a position angle of −48°. Note that no primary beam correction is applied to these maps.
Current usage metrics show cumulative count of Article Views (full-text article views including HTML views, PDF and ePub downloads, according to the available data) and Abstracts Views on Vision4Press platform.
Data correspond to usage on the plateform after 2015. The current usage metrics is available 48-96 hours after online publication and is updated daily on week days.
Initial download of the metrics may take a while.