Fig. 4
Download original image
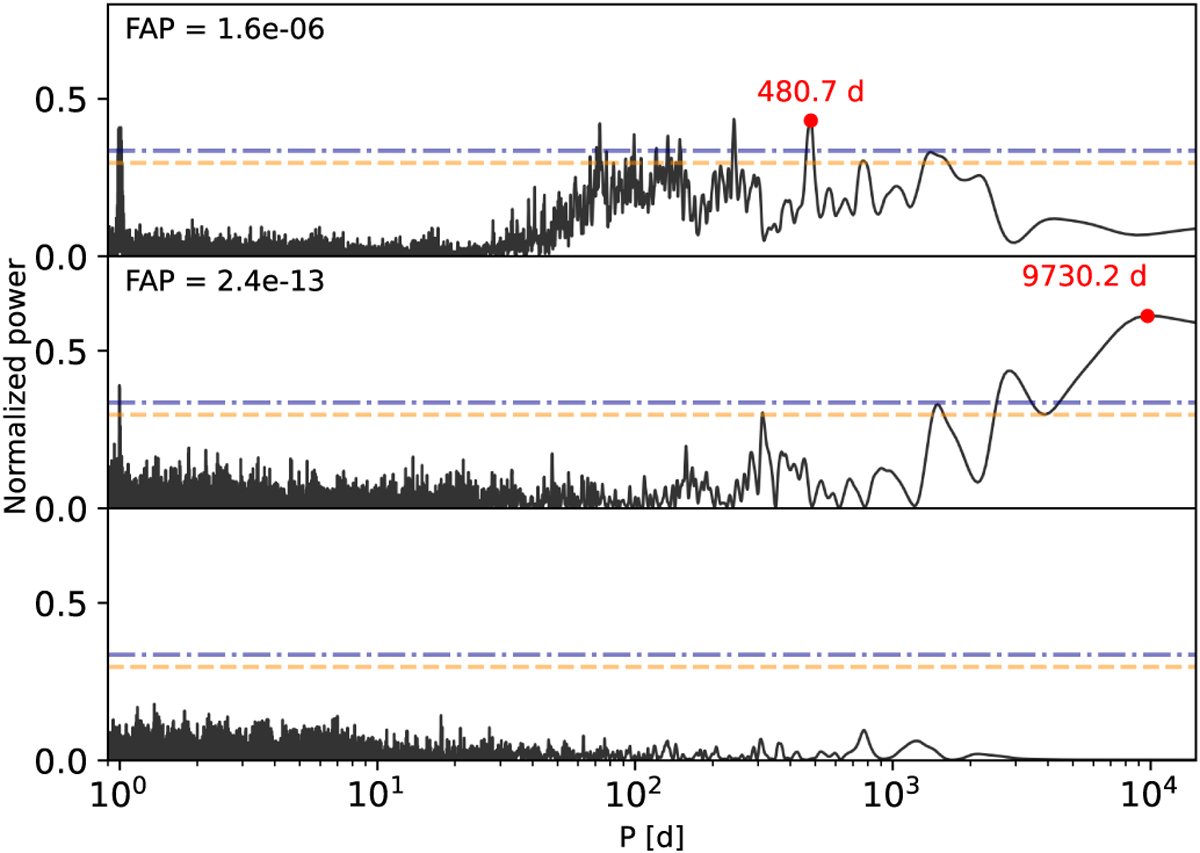
Top: periodogram of the RV time series of HD 87816. Middle: periodogram obtained after fitting a first Keplerian model with a period of 480 days. Bottom: Periodogram of the residuals of the RV time series after subtraction of the two-planet model. The horizontal lines show the different FAP levels: 1% (dashed orange line) and 0.1% (dashed-dotted blue line). The highest peak is marked with a red dot, and the corresponding period is indicated next to it.
Current usage metrics show cumulative count of Article Views (full-text article views including HTML views, PDF and ePub downloads, according to the available data) and Abstracts Views on Vision4Press platform.
Data correspond to usage on the plateform after 2015. The current usage metrics is available 48-96 hours after online publication and is updated daily on week days.
Initial download of the metrics may take a while.