Fig. A.1
Download original image
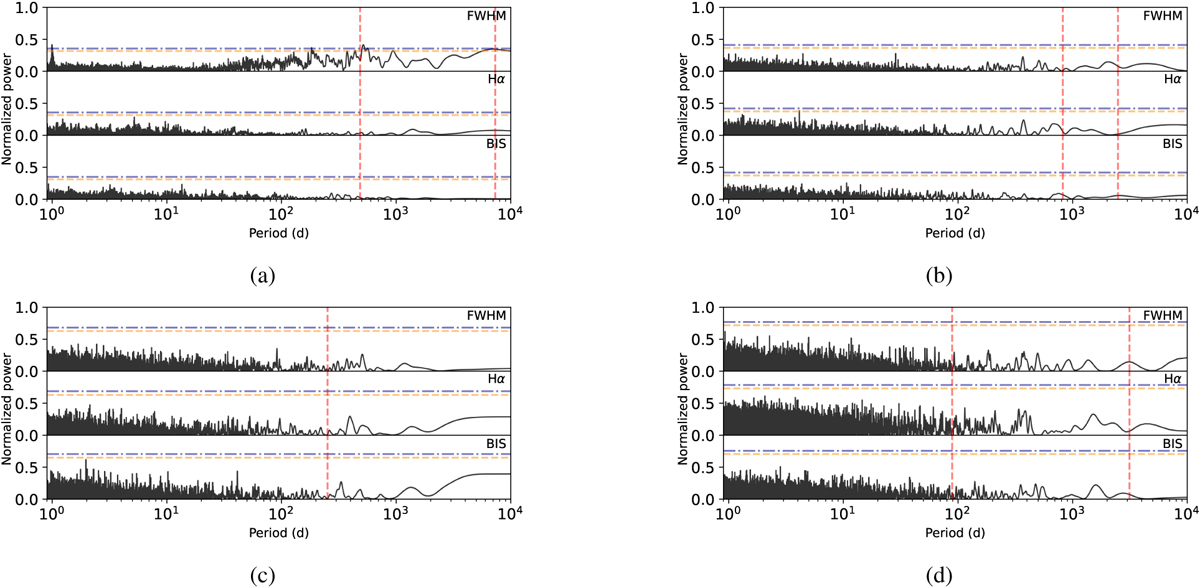
Periodograms of the time series of the FWHM, BIS, and H-alpha index for the four targets of this work: HD 87816 (panel a), HD 94890 (panel b), HD 102888 (panel c), and HD 121056 (panel d). The horizontal lines show the different FAP levels: 1% (dashed orange line) and 0.1% (dashed-dotted blue line). The vertical red lines indicate the orbital periods of the detected exoplanets around each star.
Current usage metrics show cumulative count of Article Views (full-text article views including HTML views, PDF and ePub downloads, according to the available data) and Abstracts Views on Vision4Press platform.
Data correspond to usage on the plateform after 2015. The current usage metrics is available 48-96 hours after online publication and is updated daily on week days.
Initial download of the metrics may take a while.