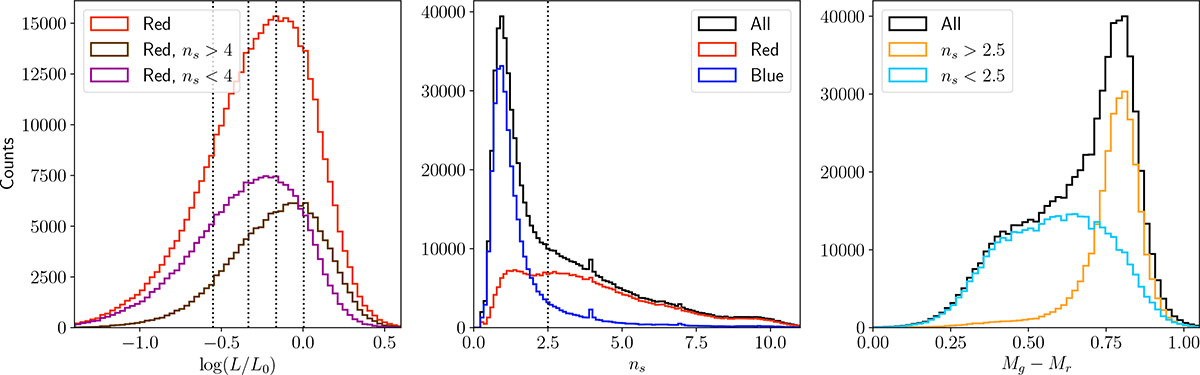
Fig. B.1.
Download original image
Distributions of galaxy properties of our sample. Top: Distributions of galaxy luminosity for our red sample (red line), red sample with high ns (brown), and red sample with low ns (purple). Middle: Distributions of Sérsic index, ns, for the full sample, red, and blue galaxy samples (in black, red and blue line, respectively). Bottom: Distributions of restframe g−r colour for our full sample (black), spheroidal (ns<2.5, light blue), and elliptical (ns>2.5, orange) galaxy samples.
Current usage metrics show cumulative count of Article Views (full-text article views including HTML views, PDF and ePub downloads, according to the available data) and Abstracts Views on Vision4Press platform.
Data correspond to usage on the plateform after 2015. The current usage metrics is available 48-96 hours after online publication and is updated daily on week days.
Initial download of the metrics may take a while.