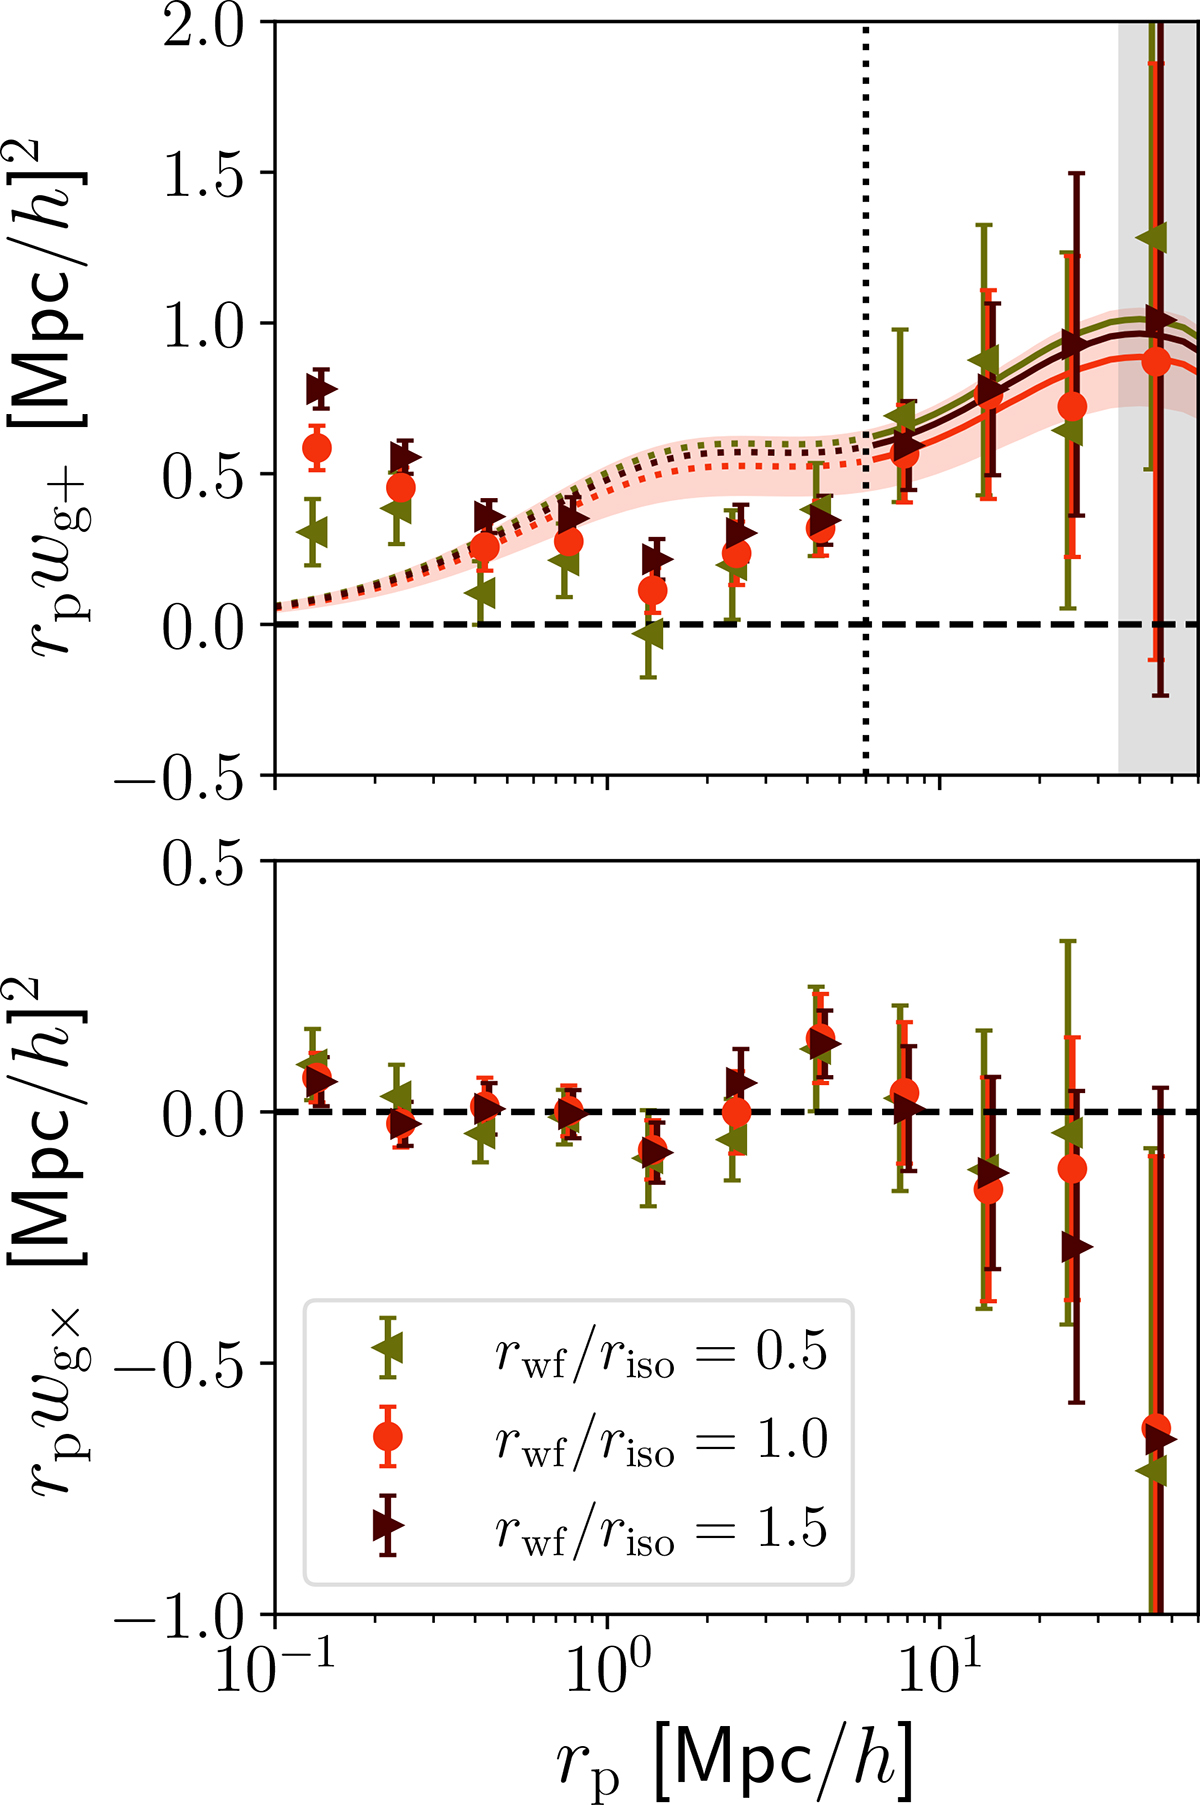
Fig. 6.
Download original image
Similar to Fig. 4, but showing measurements of intrinsically red galaxies with shapes measured using different sizes for the radial weight function (compared the isophotal radius of galaxies), as indicated in the legend. Over-plotted in the top panel are the best-fit NLA models for each sub-sample, with a red band indicating the 1-σ region around the best-fit model for the fiducial sample, with rwf/riso = 1.
Current usage metrics show cumulative count of Article Views (full-text article views including HTML views, PDF and ePub downloads, according to the available data) and Abstracts Views on Vision4Press platform.
Data correspond to usage on the plateform after 2015. The current usage metrics is available 48-96 hours after online publication and is updated daily on week days.
Initial download of the metrics may take a while.