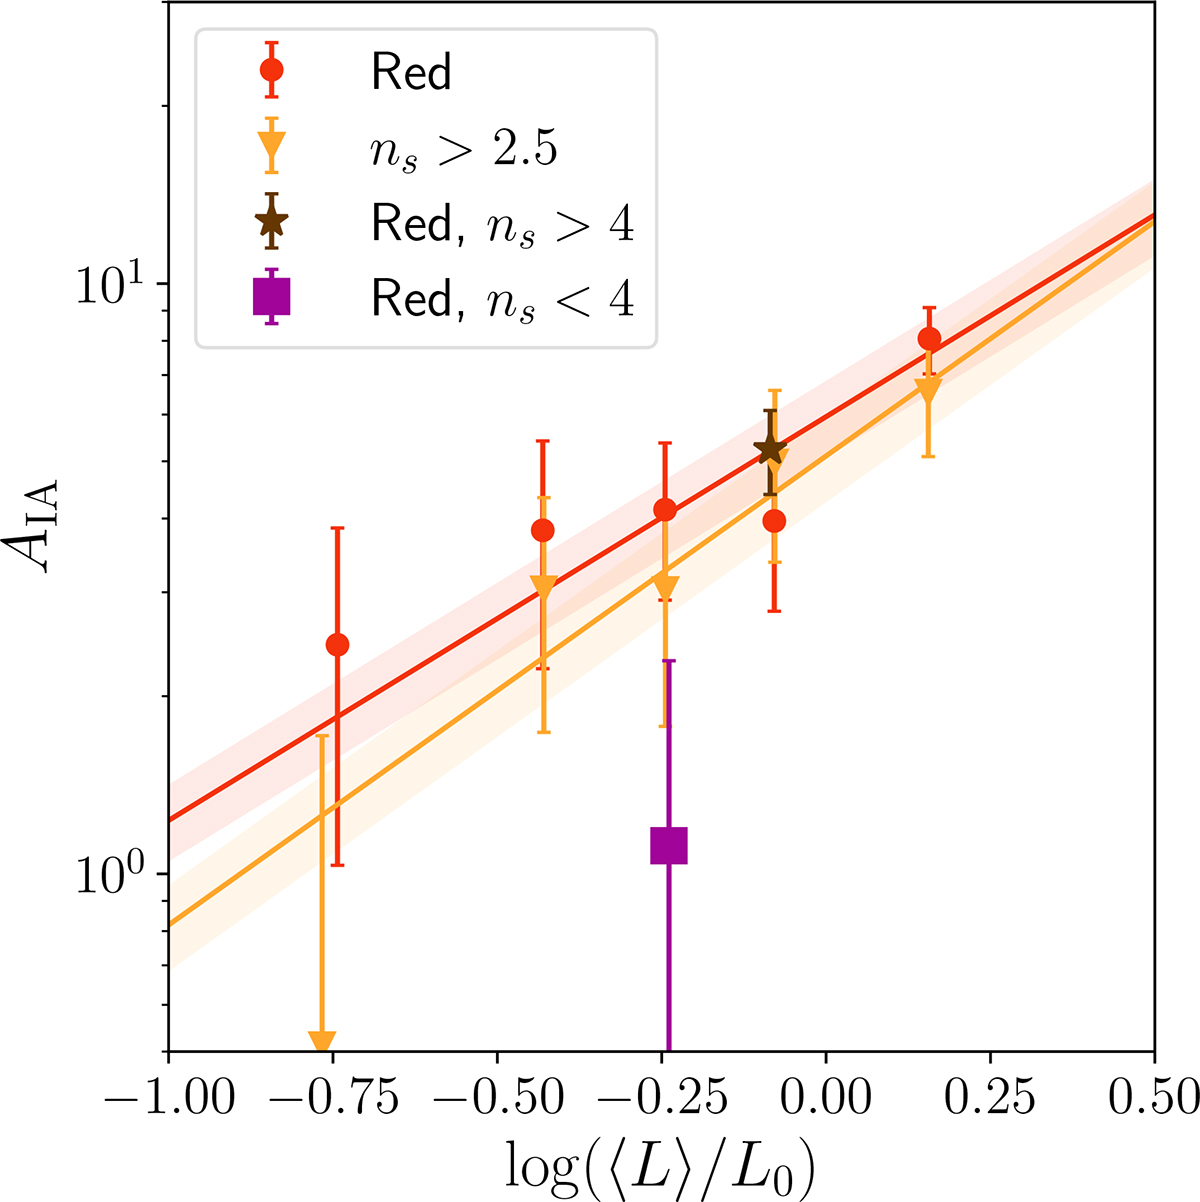
Fig. 5.
Download original image
Best-fit intrinsic alignment amplitude of NLA fits to wg+ measurements from the different galaxy sub-samples, plotted against their average luminosity logarithm. The red or ns>2.5 galaxy samples (red circles and orange triangles, respectively) are split into five luminosity bins, while the galaxy samples selected on both colour and ns (brown star or square) are not split in luminosity. A power-law luminosity-dependent AIA is fitted to the intrinsically red and ns>2.5 samples, plotted as red and orange solid lines, respectively, with the colour band indicating 1-σ intervals of the best-fit parameters.
Current usage metrics show cumulative count of Article Views (full-text article views including HTML views, PDF and ePub downloads, according to the available data) and Abstracts Views on Vision4Press platform.
Data correspond to usage on the plateform after 2015. The current usage metrics is available 48-96 hours after online publication and is updated daily on week days.
Initial download of the metrics may take a while.