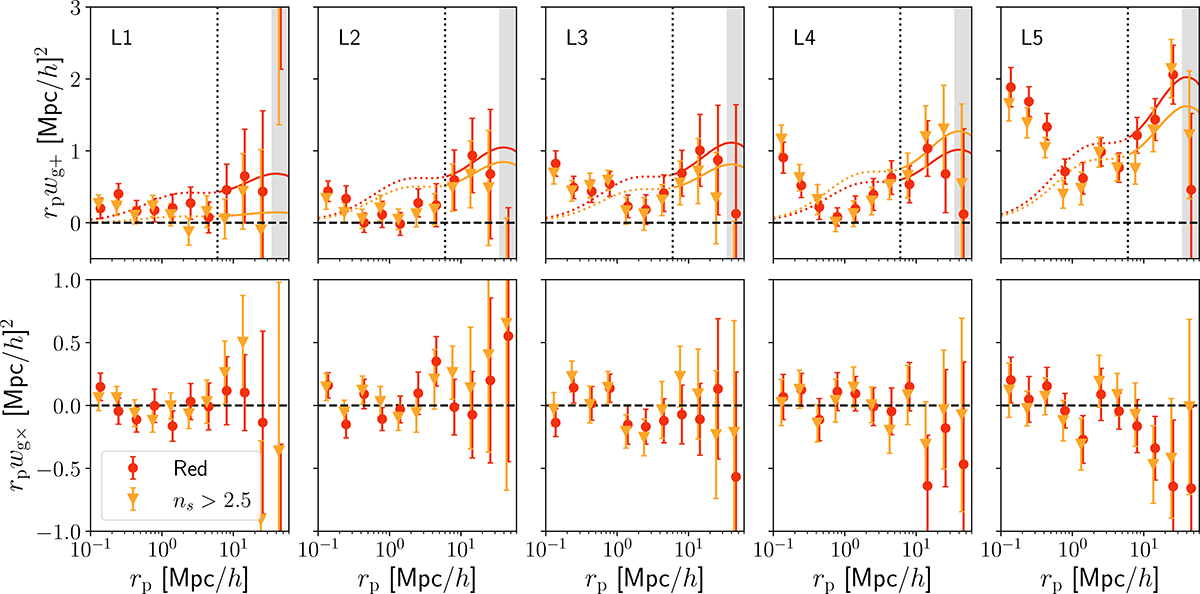
Fig. 4.
Download original image
Top: Projected position–shape correlation function measurements as a function of galaxy pair separation for the red (red circles) and high ns (orange triangles) galaxy sub-samples. The different luminosity sub-samples are indicated in the top left of each panel, with luminosity increasing from left to right. The best-fit NLA model is shown as solid lines of corresponding colour – with dotted lines where the model is no longer valid, at rp<6 Mpc/h, which is also indicated with a vertical dotted black line. The grey area indicates the region where the covariance estimation is no longer accurate. Points are slightly offset for visual clarity. Bottom: Projected correlation measurements between galaxy positions and the cross ellipticity component.
Current usage metrics show cumulative count of Article Views (full-text article views including HTML views, PDF and ePub downloads, according to the available data) and Abstracts Views on Vision4Press platform.
Data correspond to usage on the plateform after 2015. The current usage metrics is available 48-96 hours after online publication and is updated daily on week days.
Initial download of the metrics may take a while.