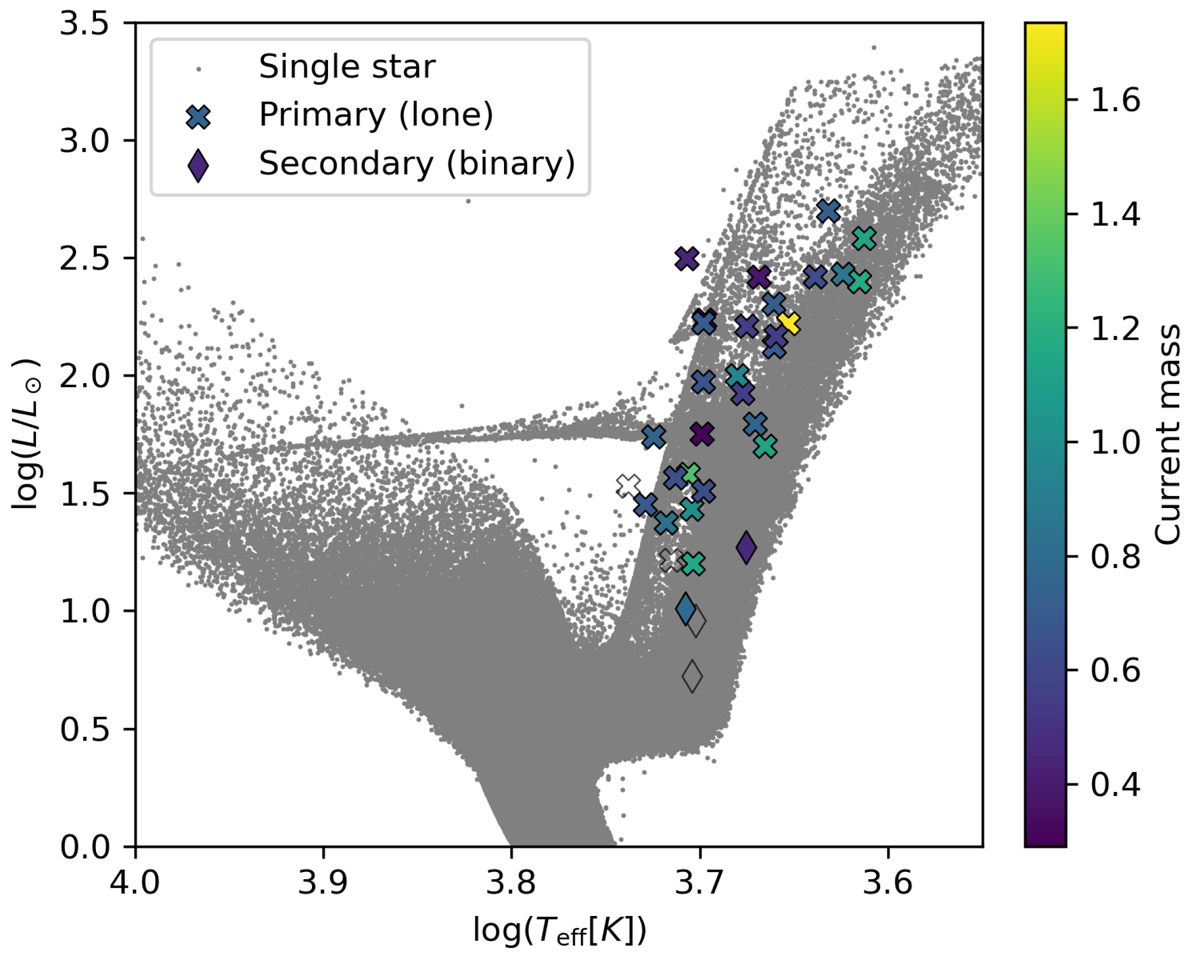
Fig. 7.
Download original image
Location on an HRD of undermassive stars in the RGB phase for the MDS17 simulation. Crosses indicate undermassive lone primaries while thin diamonds mark undermassive secondary stars in a surviving binary. The color represents the current mass of each undermassive star, and empty markers indicate the ones where detection of oscillations is not likely (pseismo, bin < 0.9). Gray points represent single stars from the simulation and are used to draw the main loci of the HRD.
Current usage metrics show cumulative count of Article Views (full-text article views including HTML views, PDF and ePub downloads, according to the available data) and Abstracts Views on Vision4Press platform.
Data correspond to usage on the plateform after 2015. The current usage metrics is available 48-96 hours after online publication and is updated daily on week days.
Initial download of the metrics may take a while.