Fig. 9.
Download original image
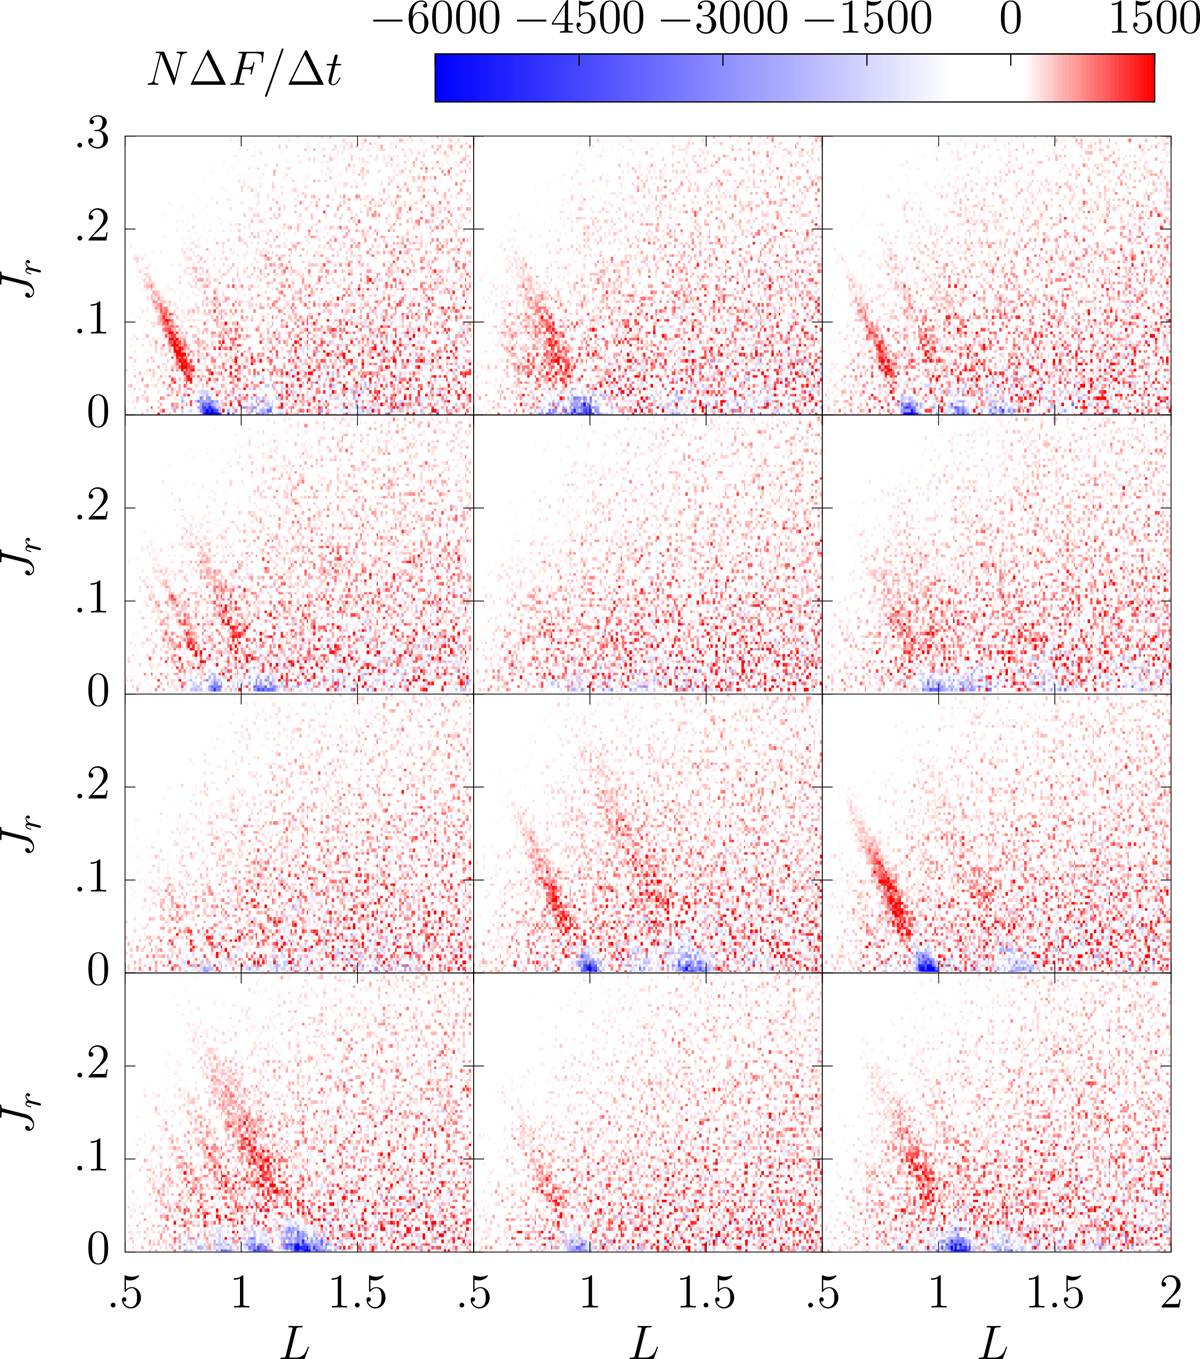
Relaxation rate, ∂F/∂t, measured in 12 independent N–body realisations, using the same convention as in Figure 3. The number, location, amplitude, and birth time of the action ridges vary strongly from one realisation to another. This is a measure of a long-term stochasticity in the vicinity of the phase transition (see also Figure 4).
Current usage metrics show cumulative count of Article Views (full-text article views including HTML views, PDF and ePub downloads, according to the available data) and Abstracts Views on Vision4Press platform.
Data correspond to usage on the plateform after 2015. The current usage metrics is available 48-96 hours after online publication and is updated daily on week days.
Initial download of the metrics may take a while.