Fig. 8.
Download original image
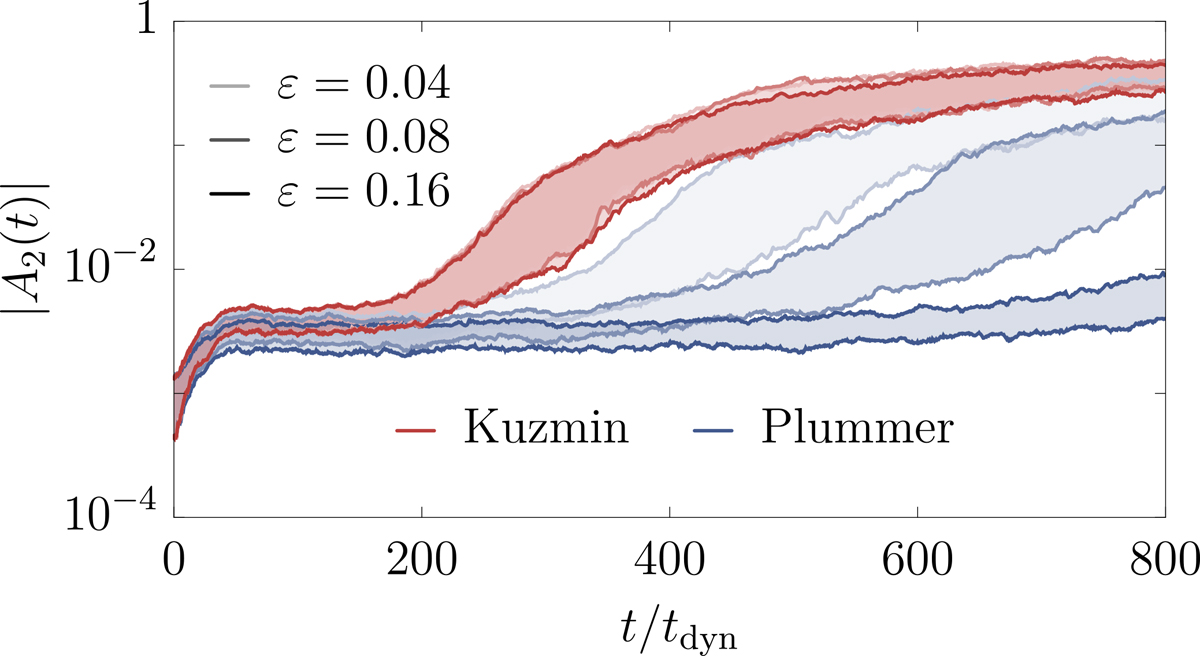
Same as Figure 1, but for various softening lengths, ε, and two different softening kernels (Appendix G). The level of transparency corresponds to different softening lengths (Equation G.1) with the bottom (resp. top) line corresponding to 20% (resp. 80%) contours over 100 independent realisations with N = 25 × 106 particles. The case Kuzmin ε = 0.16 corresponds to Figure 1. For the Plummer kernel, the larger the softening length, the slower the relaxation, and the more delayed the transition to instability. This kernel introduces a strong gravitational bias when compared with non-softened theoretical predictions (Figure G.1). On the contrary, simulations using the Kuzmin kernel behave similarly across softening lengths. Interestingly, we note that, in every case, the dispersion among realisations increases near phase transition.
Current usage metrics show cumulative count of Article Views (full-text article views including HTML views, PDF and ePub downloads, according to the available data) and Abstracts Views on Vision4Press platform.
Data correspond to usage on the plateform after 2015. The current usage metrics is available 48-96 hours after online publication and is updated daily on week days.
Initial download of the metrics may take a while.