Fig. 6.
Download original image
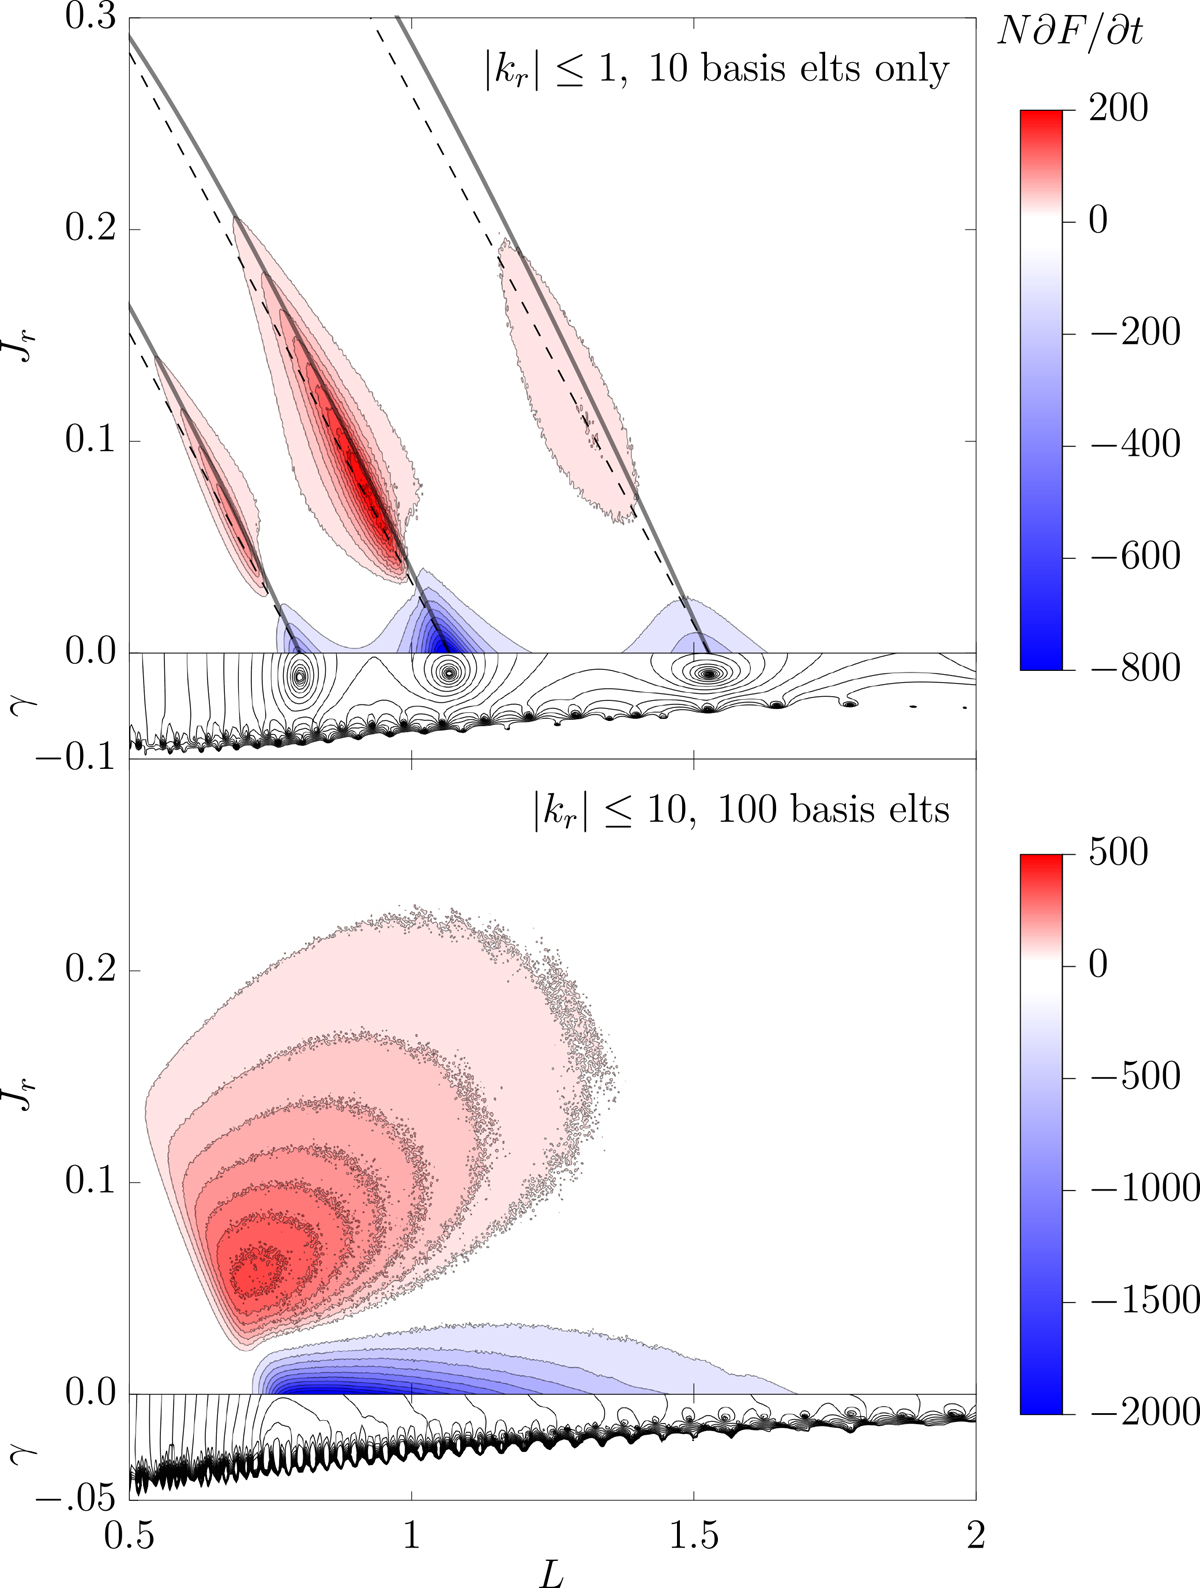
Illustration of the connexion between a disc’s long-term relaxation and the disc’s linear damped modes. In each panel, we represent in the top plot the relaxation rate in action space, predicted by BL, using the same convention as in Figure 3. In the bottom plot, we represent the disc’s susceptibility, |N(ω)| (Equation C.6) represented at the circular angular momentum corresponding to their ILR (see Equation 4). The numerical saturation of the susceptibility for damped frequencies, γ < 0, is to be expected (see e.g. Appendix B in Petersen et al. 2024). Top: Prediction purposely using an insufficient number of basis elements (Appendix C.1) and too few resonances, for illustration purposes. In that case, the disc’s susceptibility contains three clear damped modes. These modes have a direct signature in the BL relaxation rate. The black line corresponds to the ILR resonance line associated with each mode, while the dashed lines correspond to the direction of diffusion. The proximity of these two lines enhances the efficiency of ILR for heating the disc. Bottom: Same as above, but using a numerically converged linear susceptibility, namely using the same parameters as in Figure 3. In both figures we show that the disc’s long-term heating is strongly enhanced at resonance with the underlying weakly damped modes.
Current usage metrics show cumulative count of Article Views (full-text article views including HTML views, PDF and ePub downloads, according to the available data) and Abstracts Views on Vision4Press platform.
Data correspond to usage on the plateform after 2015. The current usage metrics is available 48-96 hours after online publication and is updated daily on week days.
Initial download of the metrics may take a while.