Fig. 4.
Download original image
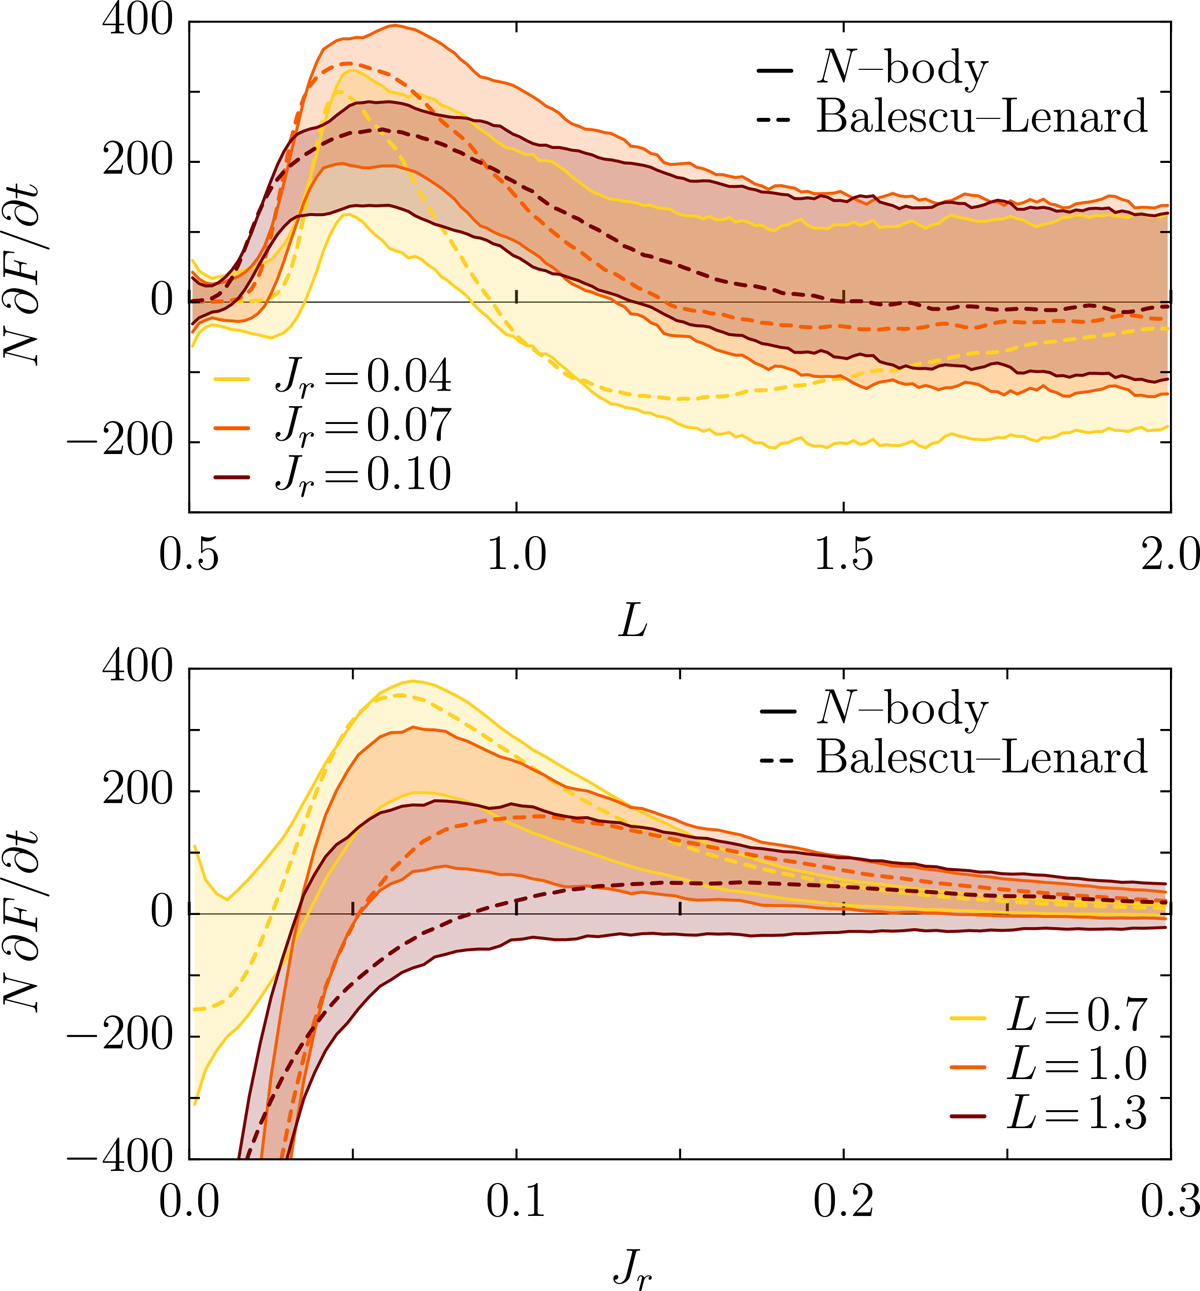
Slices of the local relaxation rate, ∂F/∂t, from Figure 3 for fixed Jr (top) or fixed L (bottom), as predicted from BL (dashed) and measured in N–body simulations (full lines). Here, ∂F/∂t in the top (resp. bottom) panel has been averaged over an interval of width δJr = ± 0.02 (resp. δL = 0.06) and subsequently smoothed with a running average of width δL = 0.03 (resp. δJr = 0.01). For the N–body, we measured ∂F/∂t in each realisation independently, estimated the standard deviation among the sample of realisations, and represented the level lines one standard deviation away from the mean value.
Current usage metrics show cumulative count of Article Views (full-text article views including HTML views, PDF and ePub downloads, according to the available data) and Abstracts Views on Vision4Press platform.
Data correspond to usage on the plateform after 2015. The current usage metrics is available 48-96 hours after online publication and is updated daily on week days.
Initial download of the metrics may take a while.