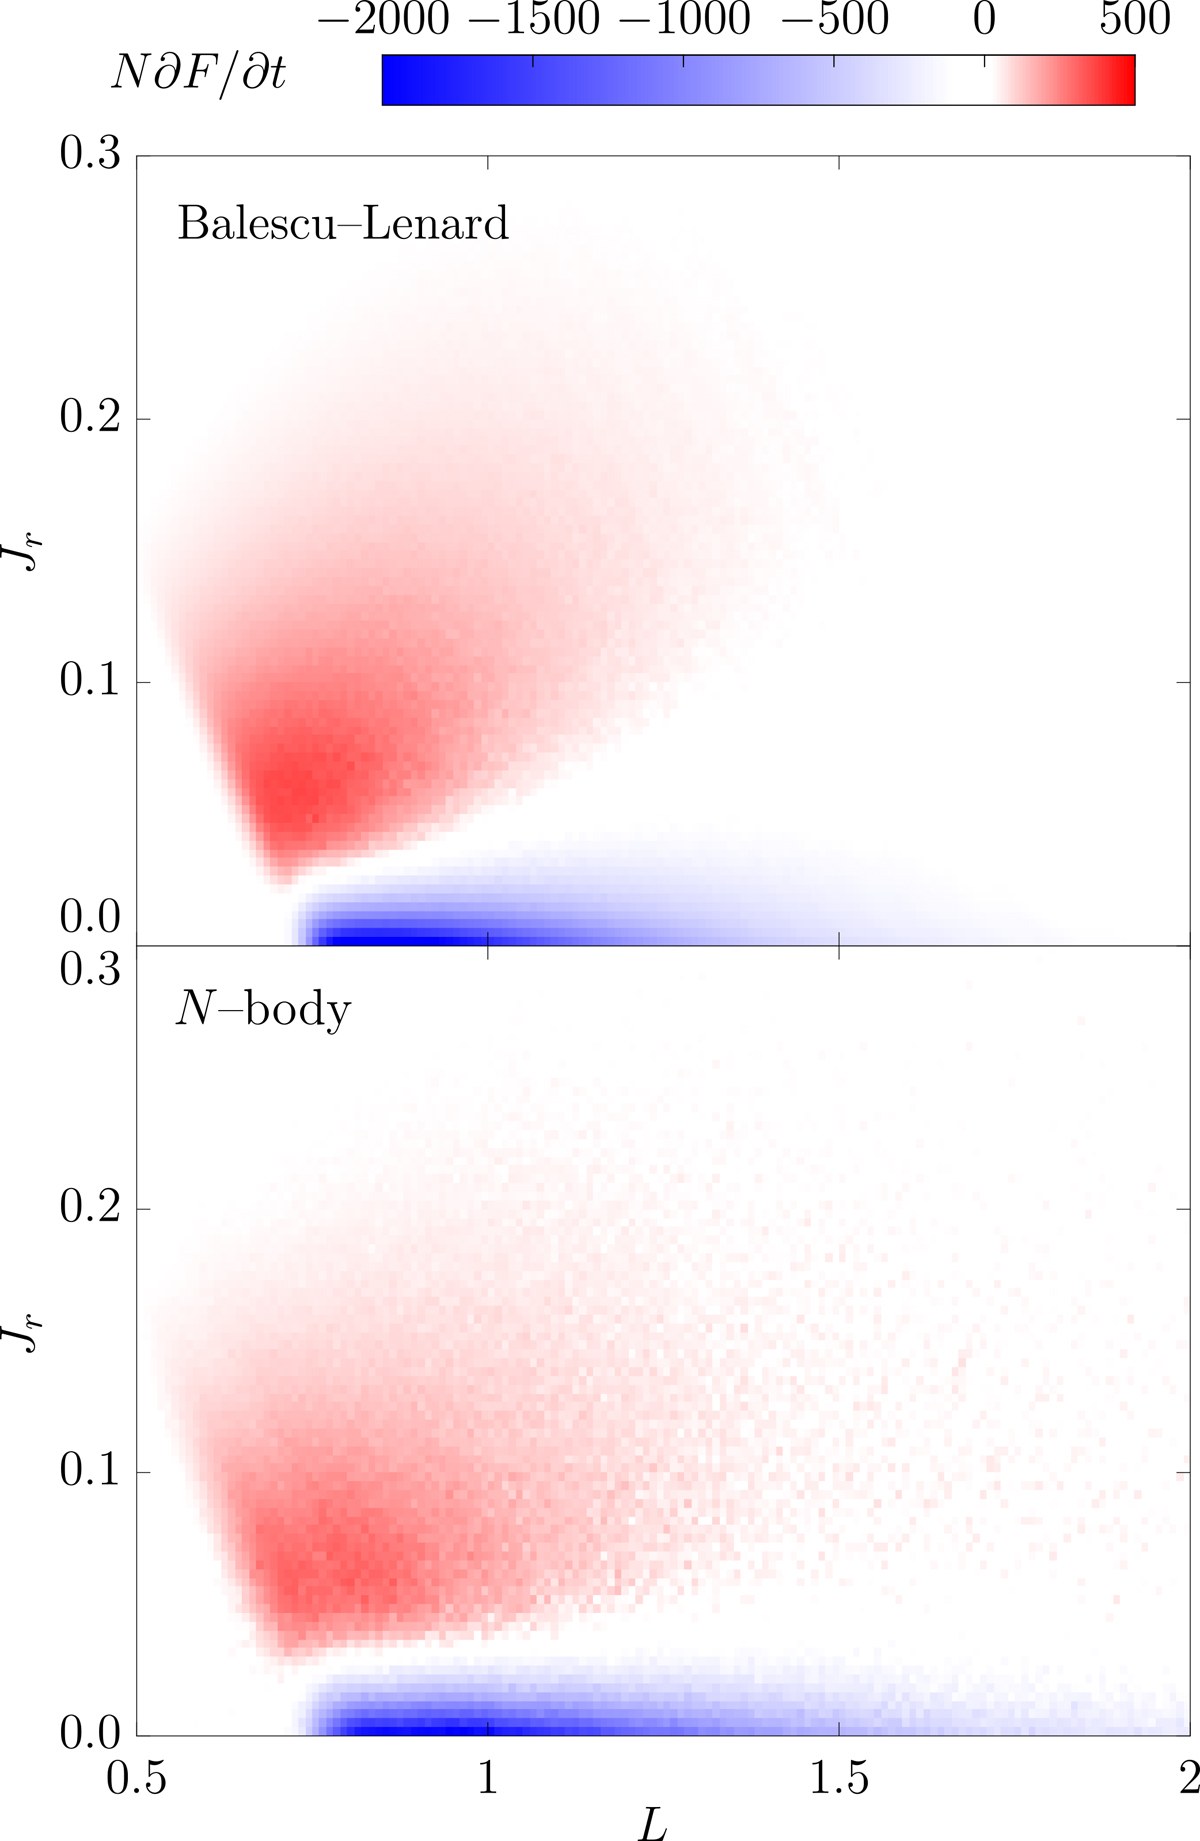
Fig. 3.
Download original image
Top: Local relaxation rate, ∂F/∂t, in action space as predicted by BL (Equation 3) for the Mestel disc (Section 2.1), computed in the centre of the action bins. The red regions correspond to an increase in the number of particles, while the blue contours correspond to a depletion. Bottom: Relaxation rate measured in N–body simulations of the same disc, averaged over 1 000 realisations with N = 25 × 106 particles each. The changes in the DF are computed at t/tdyn = 150, safely before the discs become unstable (Figure 1). The prediction and measurement are in good agreement, both in shape and amplitude. Slices in action space are illustrated in Figure 4. Collective effects play a crucial role in shaping the long-term evolution of razor-thin discs.
Current usage metrics show cumulative count of Article Views (full-text article views including HTML views, PDF and ePub downloads, according to the available data) and Abstracts Views on Vision4Press platform.
Data correspond to usage on the plateform after 2015. The current usage metrics is available 48-96 hours after online publication and is updated daily on week days.
Initial download of the metrics may take a while.