Fig. G.1.
Download original image
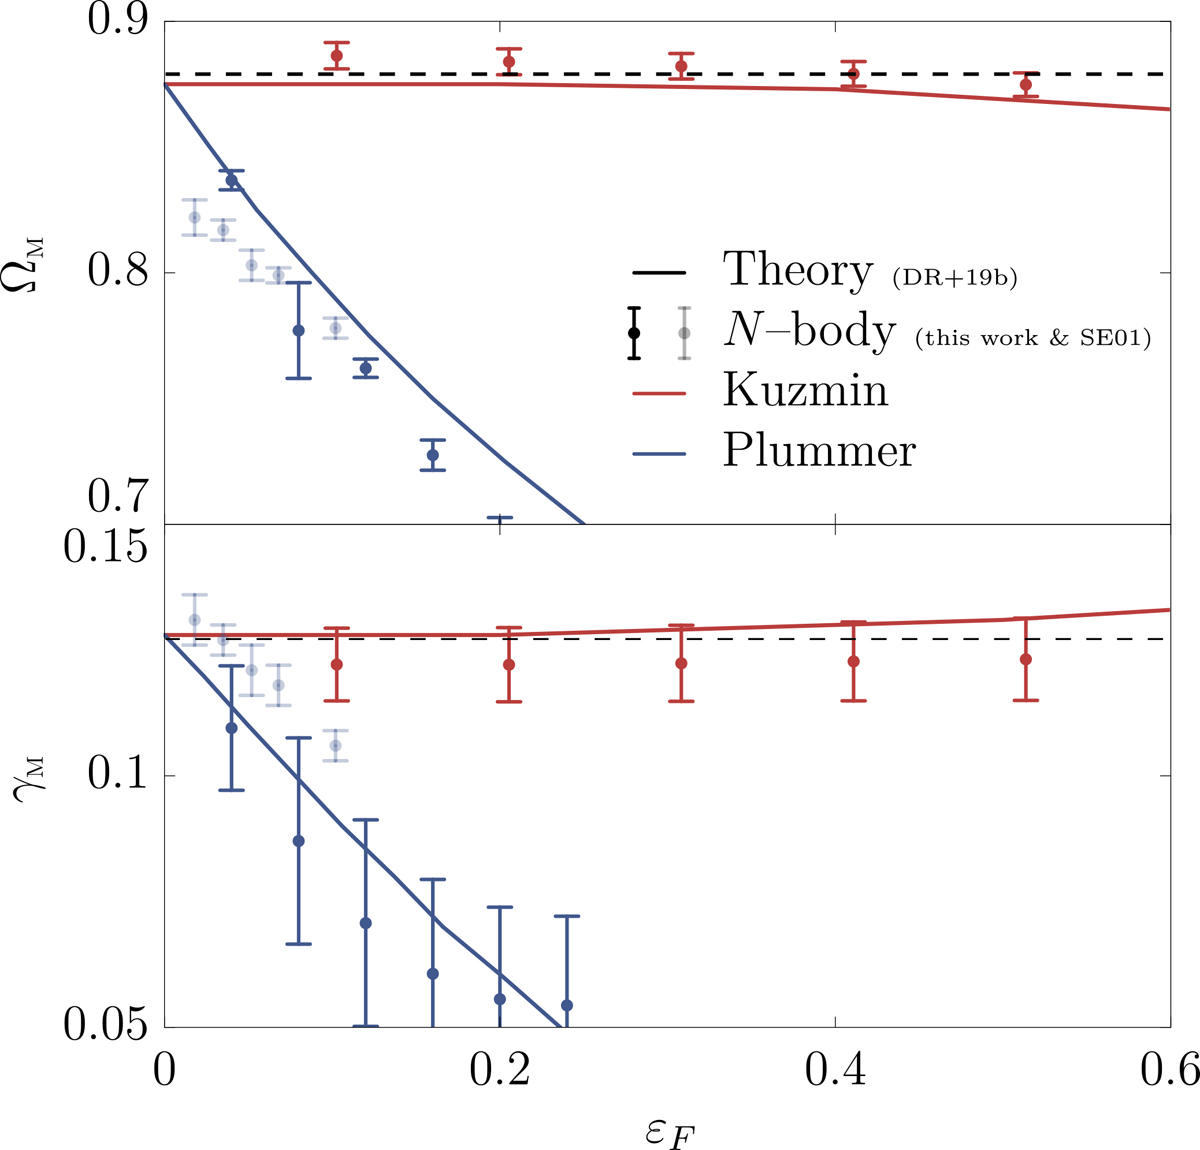
Pattern speed (top) and growth rate (bottom) of the dominant mode in Zang ν = 4 disc (Zang 1976), as a function of the rescaled softening length, εF (Equation G.5), for the Plummer softening kernel (blue – Equation G.2) and the Kuzmin kernel (red – Equation G.3). The theoretical predictions (plain lines) are reproduced from DR+19b (Figure 3 therein), with the dashed line corresponding to the Newtonian (non-softened) prediction from Evans & Read (1998) (table D1b therein). The N–body measurements are from Sellwood & Evans (2001) (faint dots SE01 – Plummer softening only – Figure 1 panel b therein), and our own measurements (plain dots – both kernels). Here, we recover that the Plummer kernel has a strong gravity bias, i.e. a predicted change in the mode’s property ![]() as one varies the considered softening length, while the Kuzmin kernel satisfies
as one varies the considered softening length, while the Kuzmin kernel satisfies ![]() .
.
Current usage metrics show cumulative count of Article Views (full-text article views including HTML views, PDF and ePub downloads, according to the available data) and Abstracts Views on Vision4Press platform.
Data correspond to usage on the plateform after 2015. The current usage metrics is available 48-96 hours after online publication and is updated daily on week days.
Initial download of the metrics may take a while.