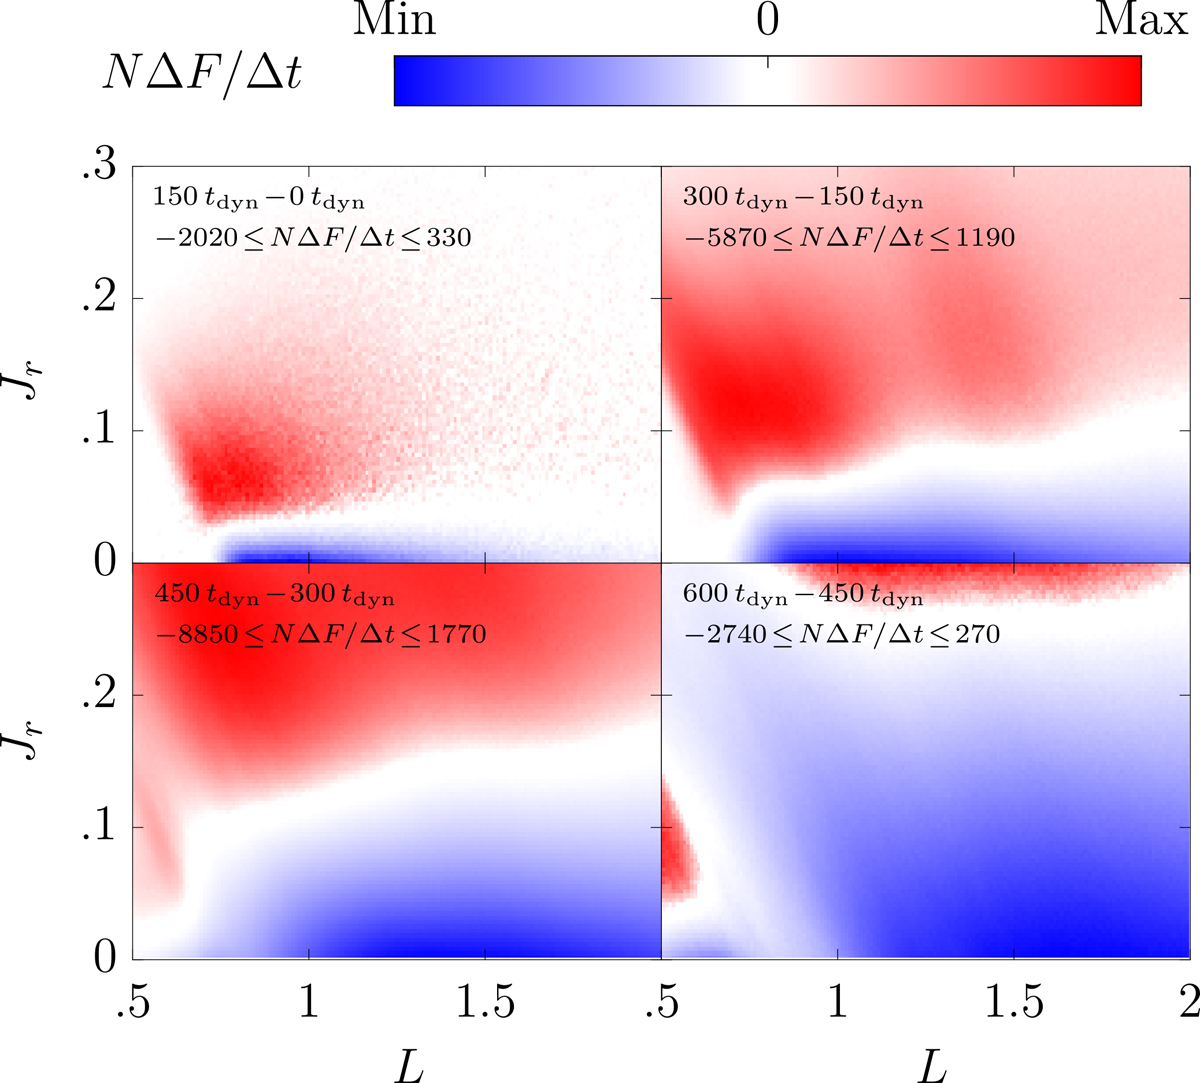
Fig. B.5.
Download original image
Same as in the bottom panel of Figure 3, but focusing here on later times, i.e. beyond the disc’s initial slow collisional evolution (Figure 1). The rate of change of the DF is estimated through simple time differences, as indicated in each panel. In each panel, the colours are rescaled to the minimum and maximum value of the local relaxation rate in that panel, as indicated therein. For simplicity, even at late times, actions remain evaluated within the disc’s initial unperturbed axisymmetric potential from Equation (1).
Current usage metrics show cumulative count of Article Views (full-text article views including HTML views, PDF and ePub downloads, according to the available data) and Abstracts Views on Vision4Press platform.
Data correspond to usage on the plateform after 2015. The current usage metrics is available 48-96 hours after online publication and is updated daily on week days.
Initial download of the metrics may take a while.