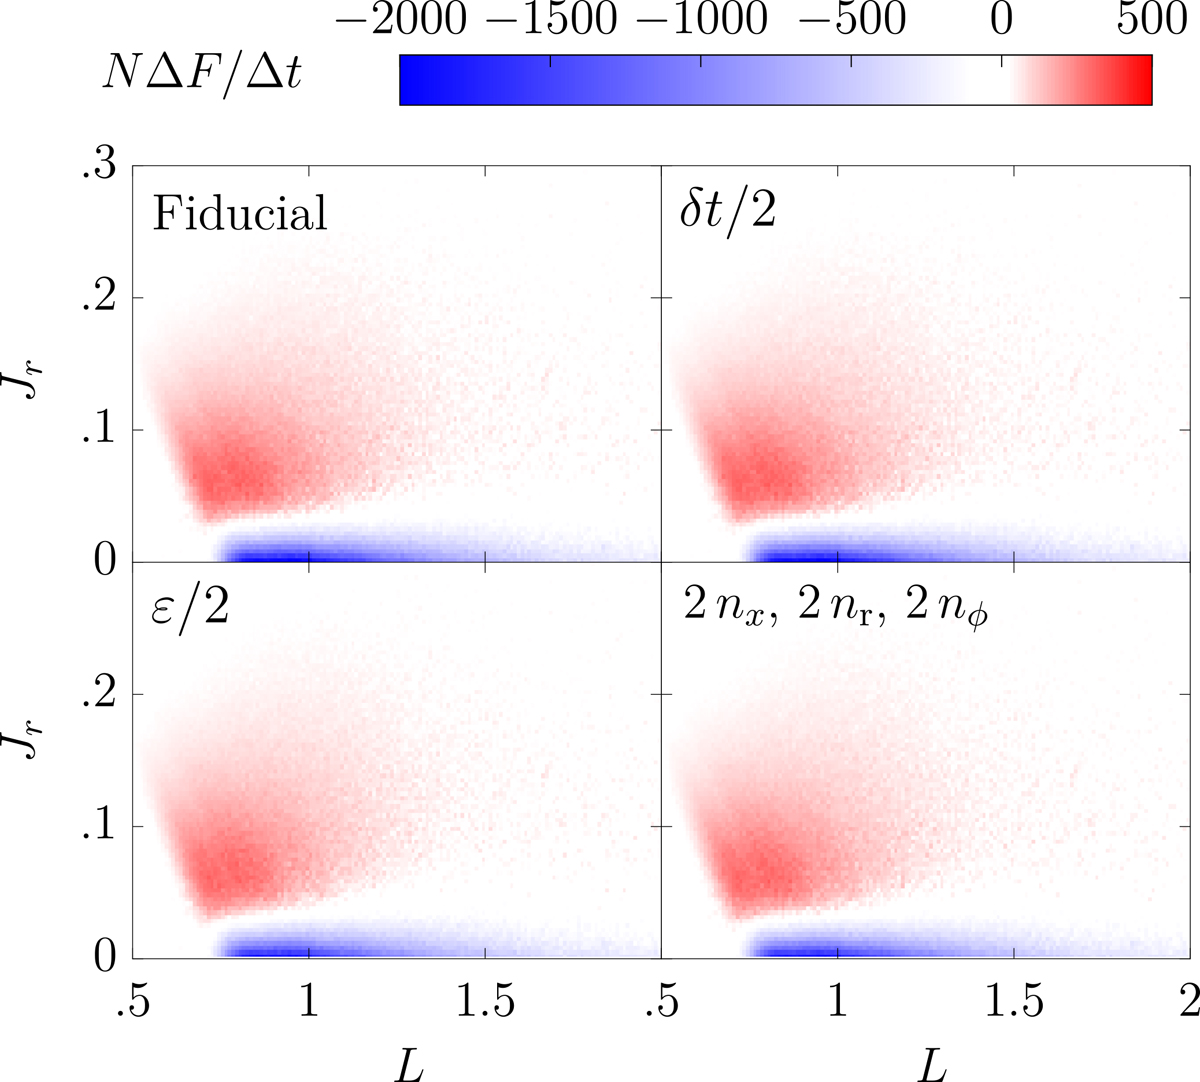
Fig. B.3.
Download original image
Same as in the bottom panel of Figure 3. Compared to the fiducial run (top left), we either halved the integration timestep (top right); halved the softening length (bottom left); or doubled the sizes of the Cartesian, radial, and azimuthal grids (bottom right). In all cases, the measurements of the local relaxation rate are fully consistent with one another. Here, the use of the Kuzmin softening kernel (Appendix G) is instrumental to obtain consistent results over a wide range of softening lengths (see Section 4.3).
Current usage metrics show cumulative count of Article Views (full-text article views including HTML views, PDF and ePub downloads, according to the available data) and Abstracts Views on Vision4Press platform.
Data correspond to usage on the plateform after 2015. The current usage metrics is available 48-96 hours after online publication and is updated daily on week days.
Initial download of the metrics may take a while.