Fig. 1.
Download original image
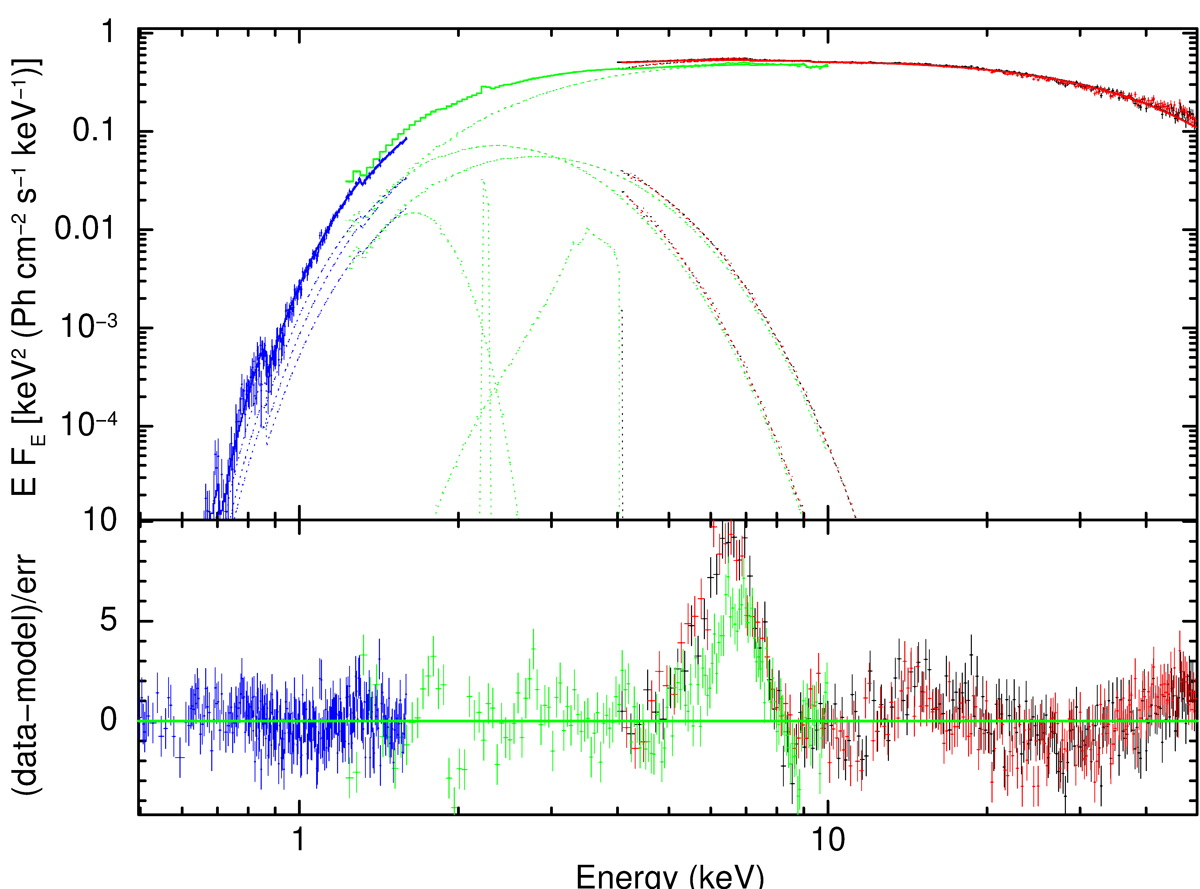
Unfolded average spectrum (0.5–50 keV) of the persistent emission from SRGA J1444. Top panel: merged XMM-Newton RGS (blue points), EPIC-pn (green points) and NuSTAR FPMA and FPMB (black and red points, respectively) are shown as fitted to the semi-phenomenological best-fit model constant*tbabs (bbodyrad + diskbb + nthComp + gauSi + gauAu+ disklineAr + disklineFe)*edge*edge*edge (see Sect. 3.1). Bottom panel: residuals in units of χ with respect to the best-fit model but with the disklineFe component at 6.4 keV removed.
Current usage metrics show cumulative count of Article Views (full-text article views including HTML views, PDF and ePub downloads, according to the available data) and Abstracts Views on Vision4Press platform.
Data correspond to usage on the plateform after 2015. The current usage metrics is available 48-96 hours after online publication and is updated daily on week days.
Initial download of the metrics may take a while.