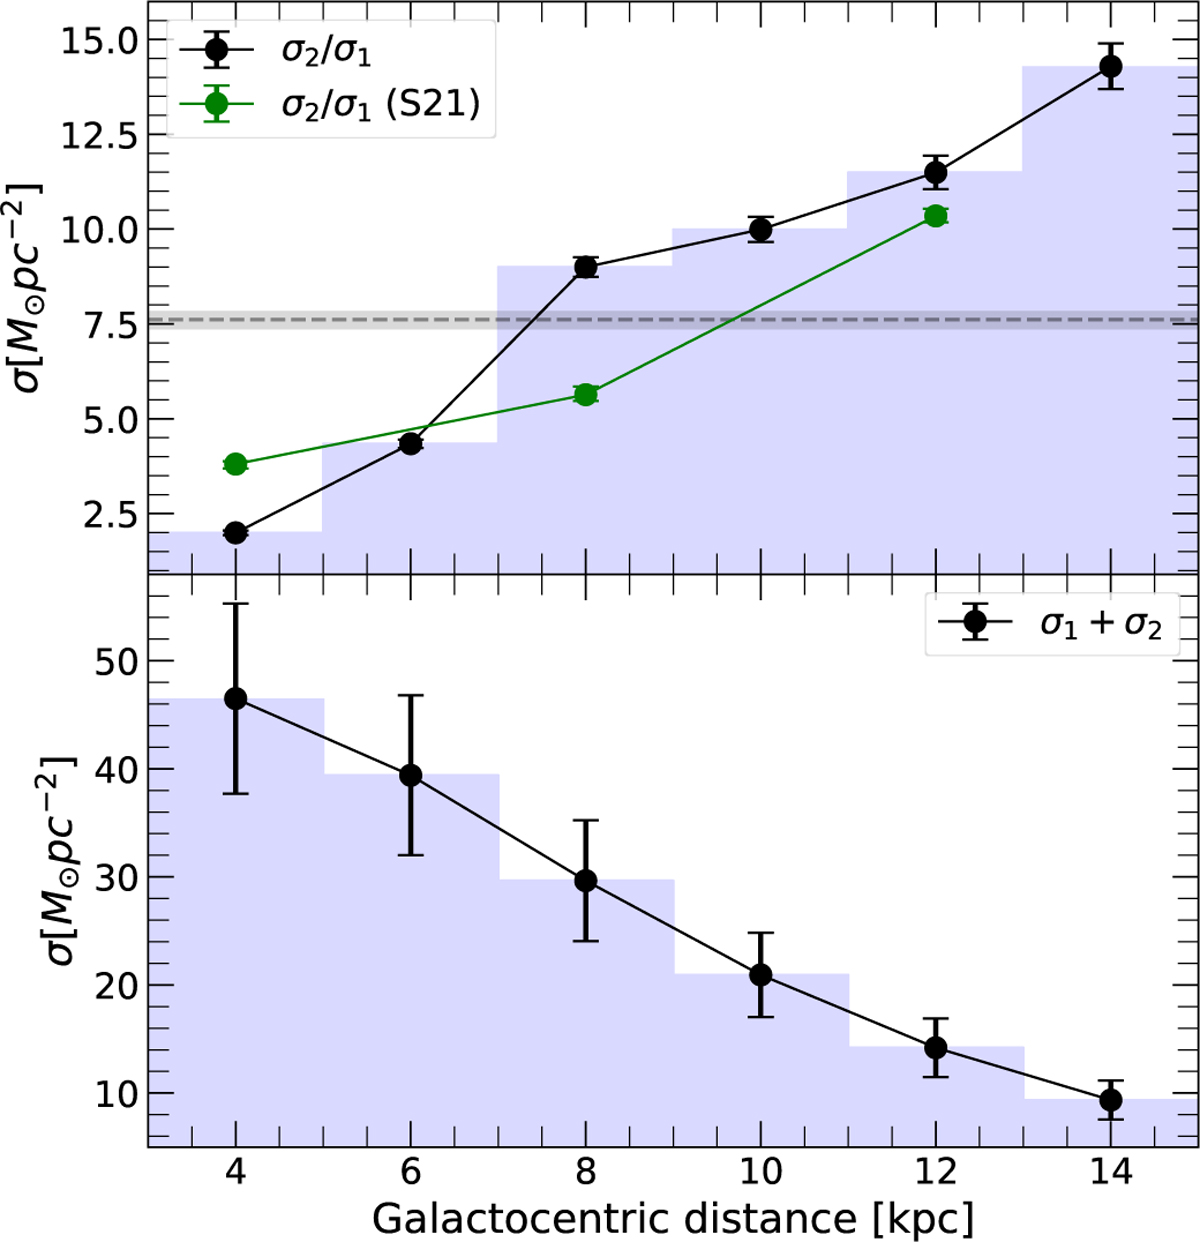
Fig. 9
Download original image
Ratio (top panel) and the sum of the surface mass densities (bottom panel) related to the second and first infall events as a function of Galactocentric distance R [kpc]. The dashed line in the top panel represents the global fitted value, and the shaded area is the related uncertainty. Note: the errors associated with the total regional surface mass densities are calculated as described in the text. Results from S21 are denoted in green.
Current usage metrics show cumulative count of Article Views (full-text article views including HTML views, PDF and ePub downloads, according to the available data) and Abstracts Views on Vision4Press platform.
Data correspond to usage on the plateform after 2015. The current usage metrics is available 48-96 hours after online publication and is updated daily on week days.
Initial download of the metrics may take a while.