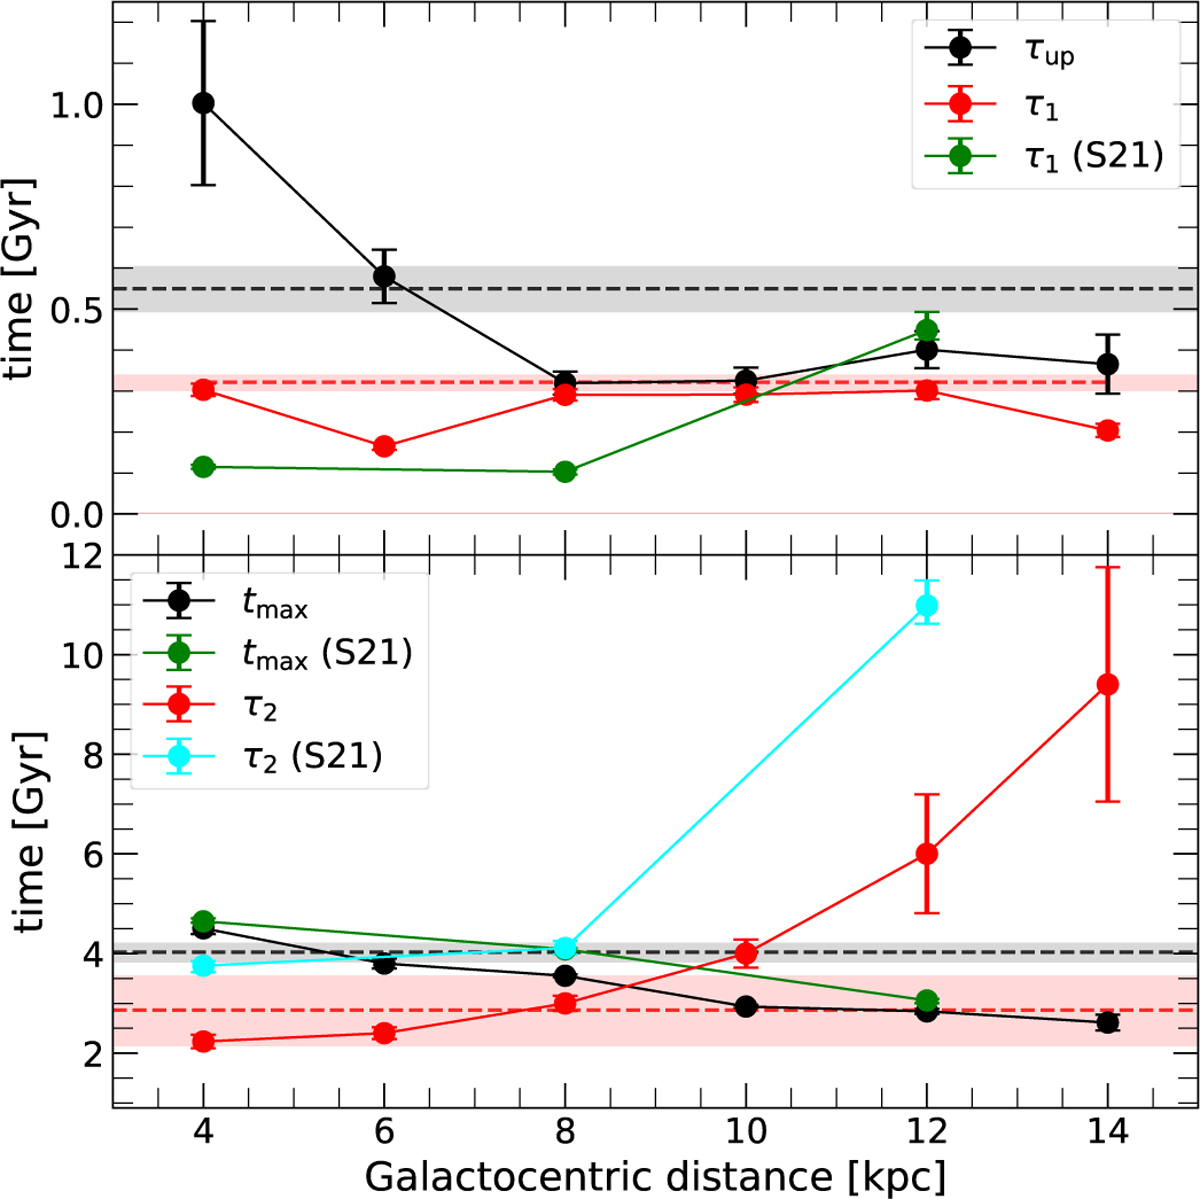
Fig. 8
Download original image
Characteristic ascending and descending accretion timescales (τ1, τ2, and τup) and time delay (tmax) from the best-fit results as a function of Galactocentric distance R [kpc]. While the continuous lines represent the regional fits, the global value is indicated by dashed lines. Error bars and shaded areas show the estimated uncertainties of the fitted global and regional parameters. Results from S21 are denoted with green and cyan.
Current usage metrics show cumulative count of Article Views (full-text article views including HTML views, PDF and ePub downloads, according to the available data) and Abstracts Views on Vision4Press platform.
Data correspond to usage on the plateform after 2015. The current usage metrics is available 48-96 hours after online publication and is updated daily on week days.
Initial download of the metrics may take a while.