Open Access
Fig. 7
Download original image
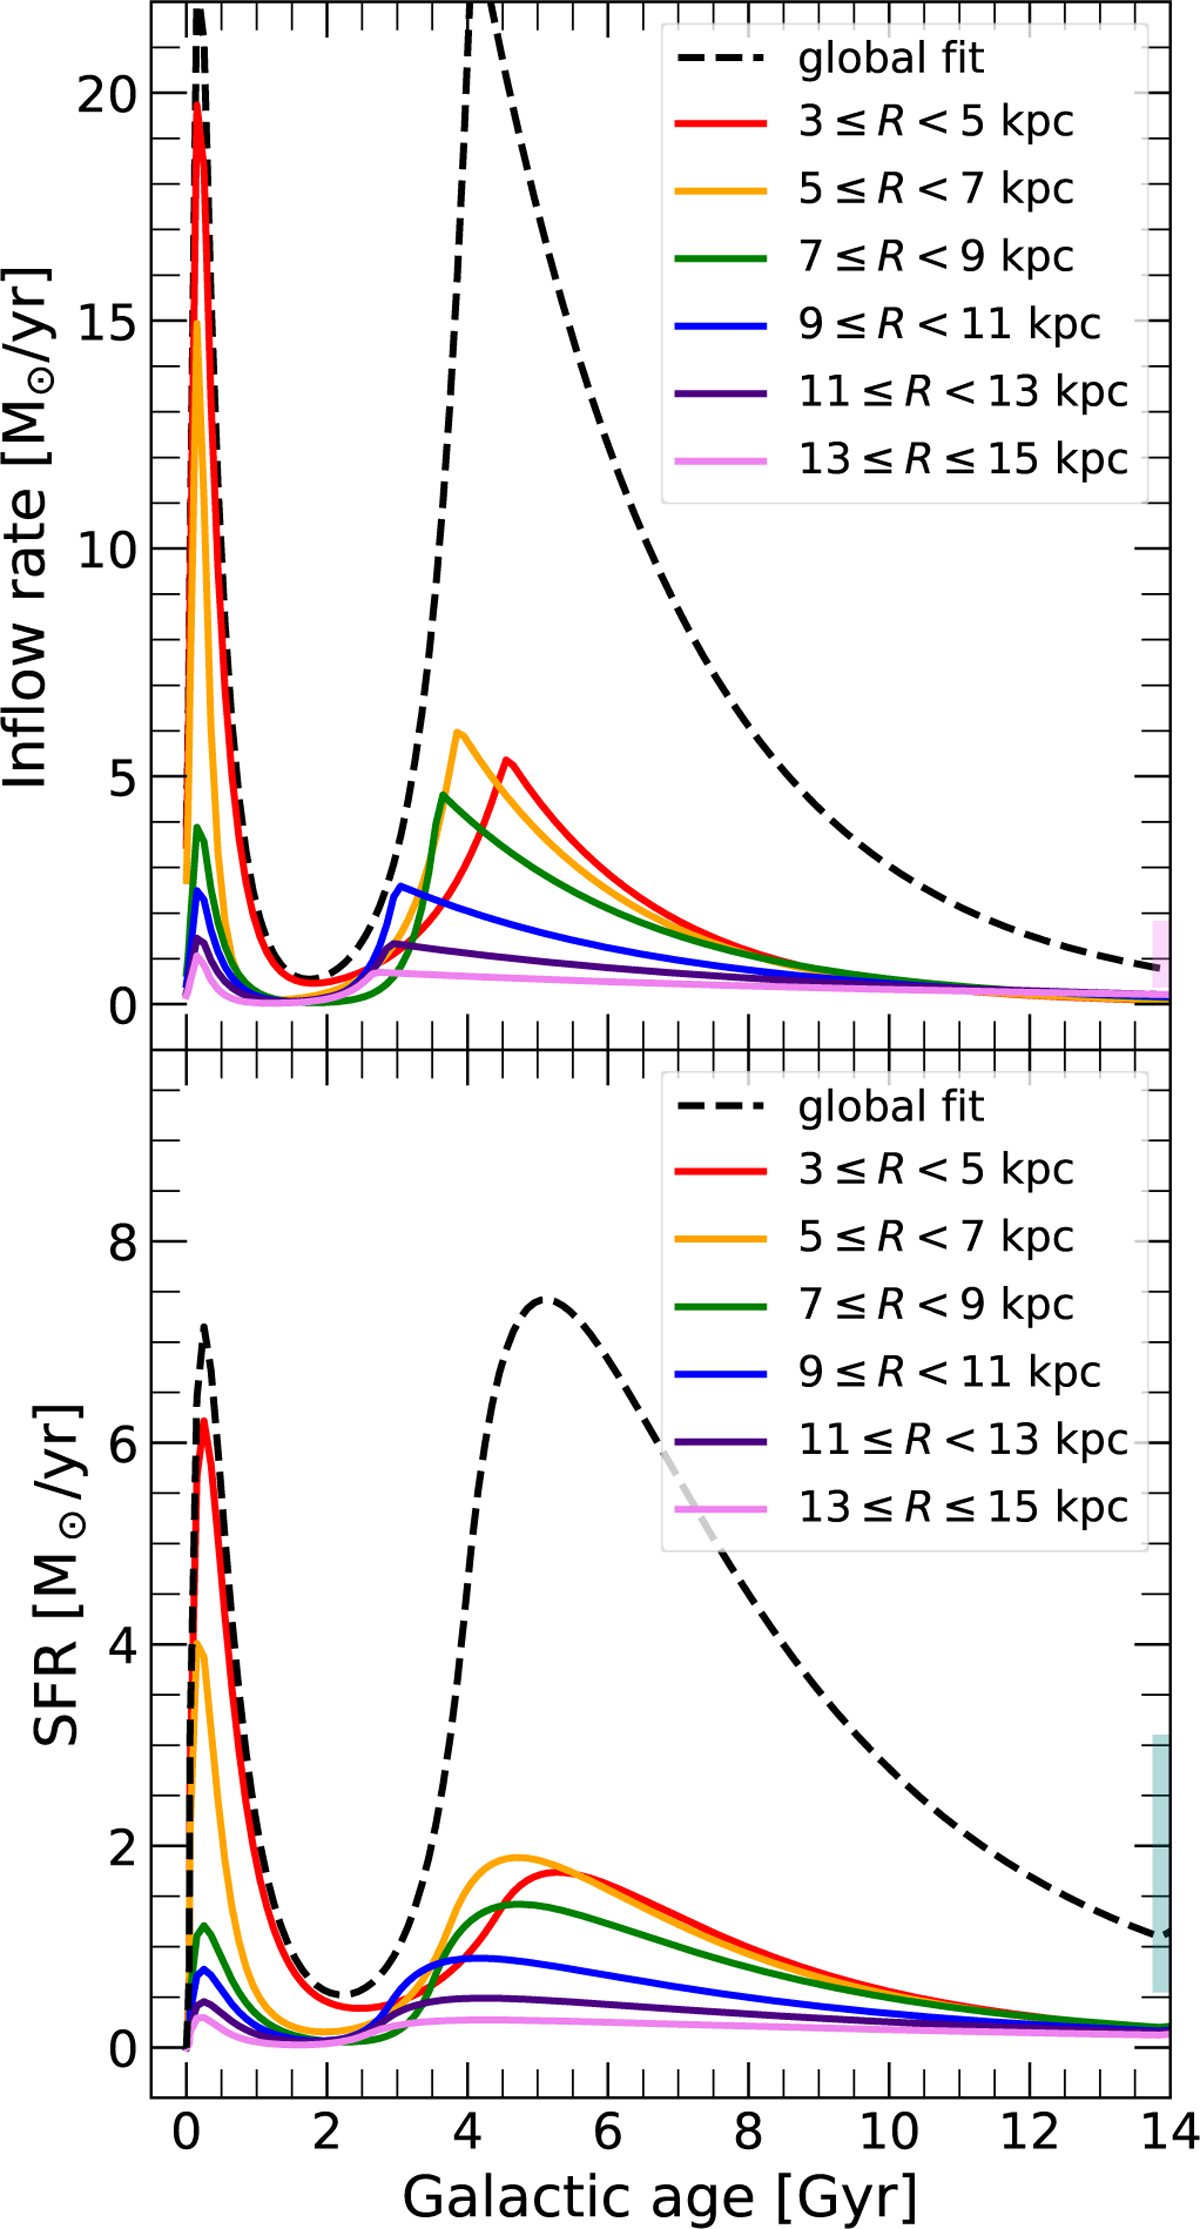
Top: inflow rates as a function of galactic age, where t = 0 Gyr is the beginning of the Galactic formation, and t = 14 Gyr is present. Bottom: SFR as a function of time. The dashed and colored curves show the results of the global and the regional best-fit simulations, respectively.
Current usage metrics show cumulative count of Article Views (full-text article views including HTML views, PDF and ePub downloads, according to the available data) and Abstracts Views on Vision4Press platform.
Data correspond to usage on the plateform after 2015. The current usage metrics is available 48-96 hours after online publication and is updated daily on week days.
Initial download of the metrics may take a while.