Fig. 6
Download original image
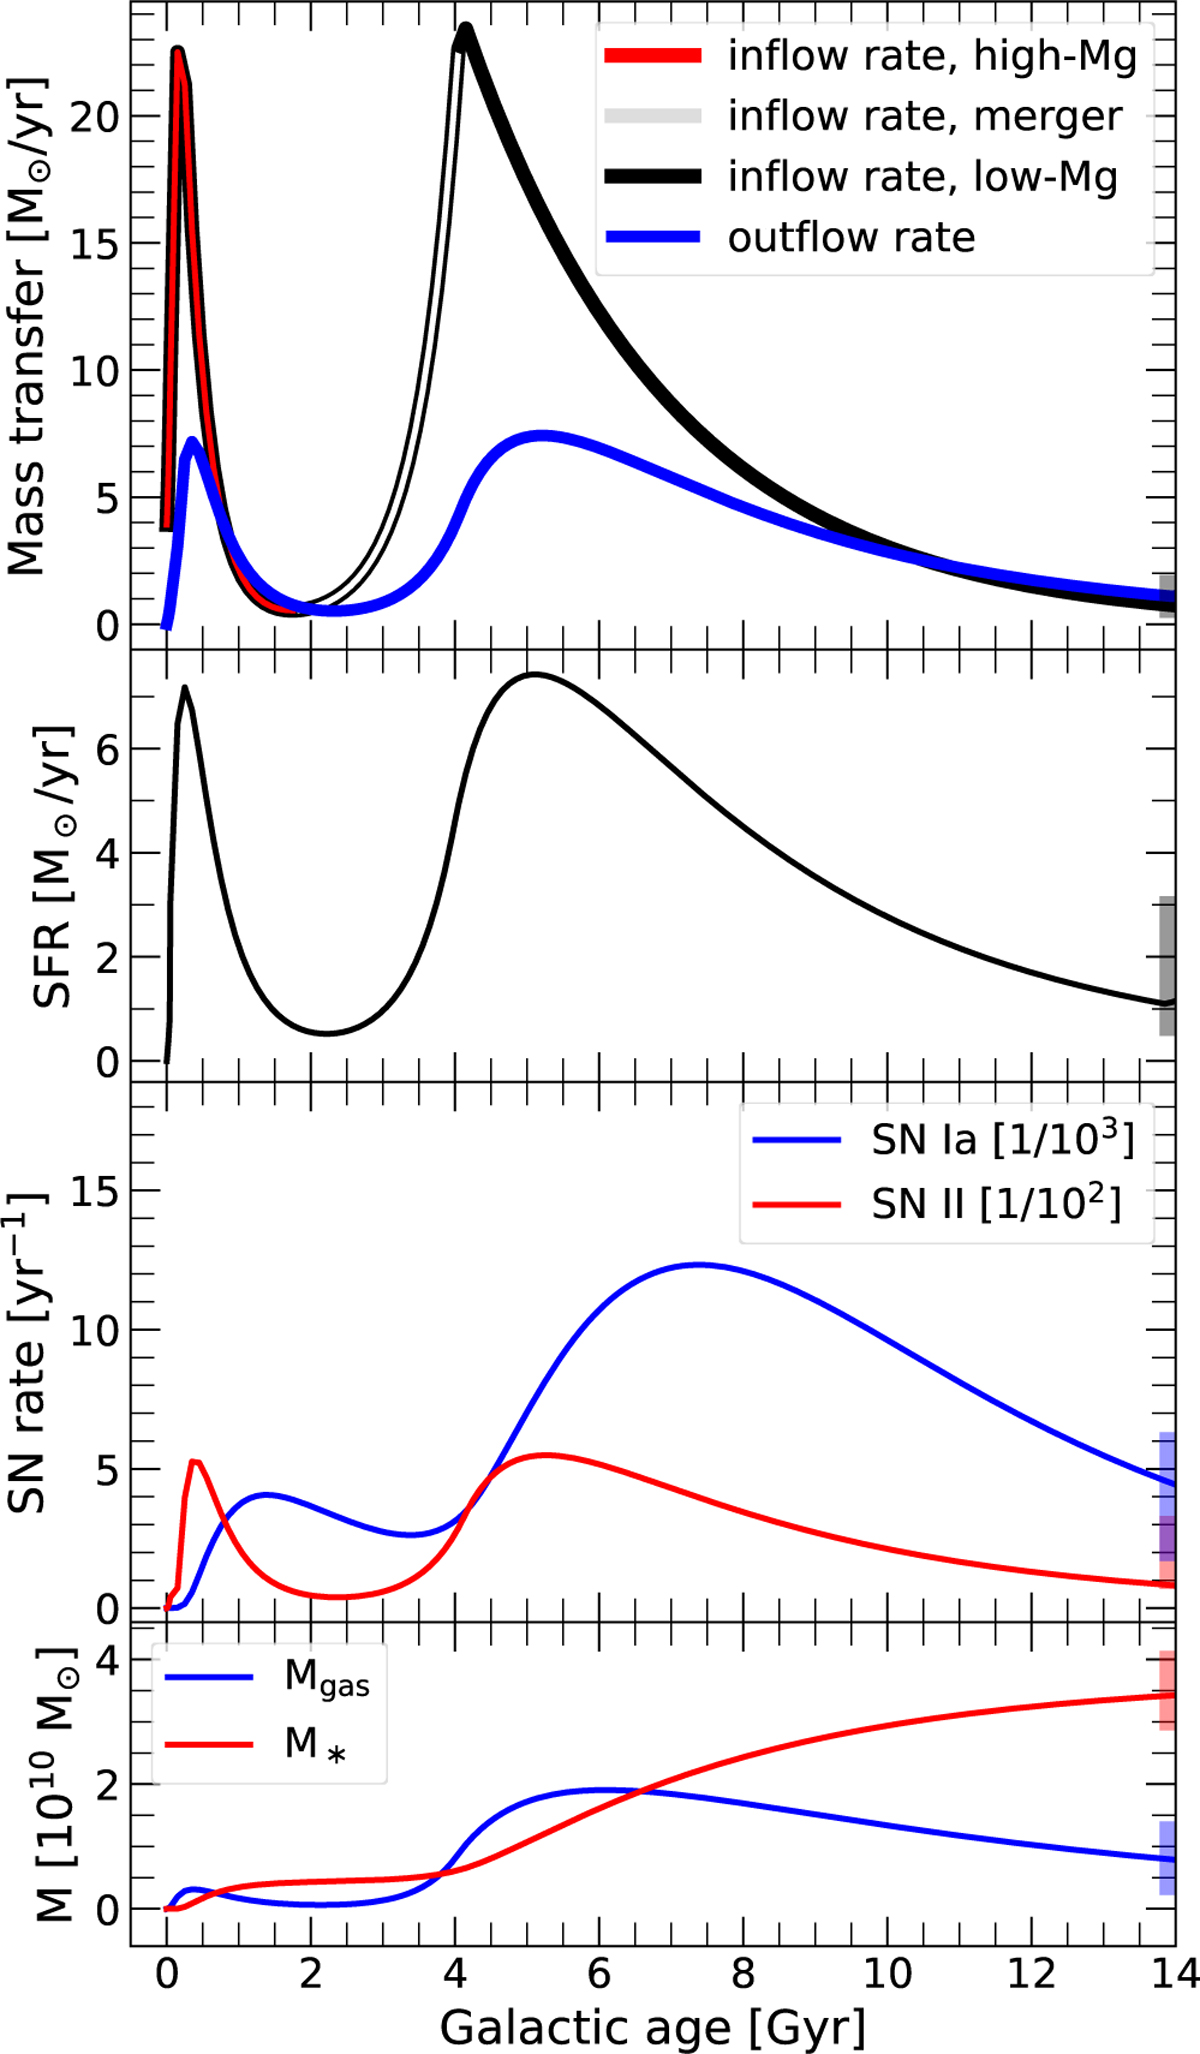
Inflow and outflow rates (top panel), SFR (second panel), rates of SNe type Ia and II (third panel), Galactic mass, M⋆, enclosed in stars, and mass, Mgas, of the gas (bottom panel) as a function of galactic age, where t = 0 Gyr is the beginning of the Galactic formation and t = 14 Gyr is the present. The shaded areas with the corresponding colors represent the present-day measured values for each parameter (see Table 2). The inflow rate presented in the top panel includes the highMg (formation) and low-Mg (merger relaxation) phases, that are marked with red and black curves, while the rising accretion of the merger phase is marked with gray.
Current usage metrics show cumulative count of Article Views (full-text article views including HTML views, PDF and ePub downloads, according to the available data) and Abstracts Views on Vision4Press platform.
Data correspond to usage on the plateform after 2015. The current usage metrics is available 48-96 hours after online publication and is updated daily on week days.
Initial download of the metrics may take a while.