Fig. 5

Download original image
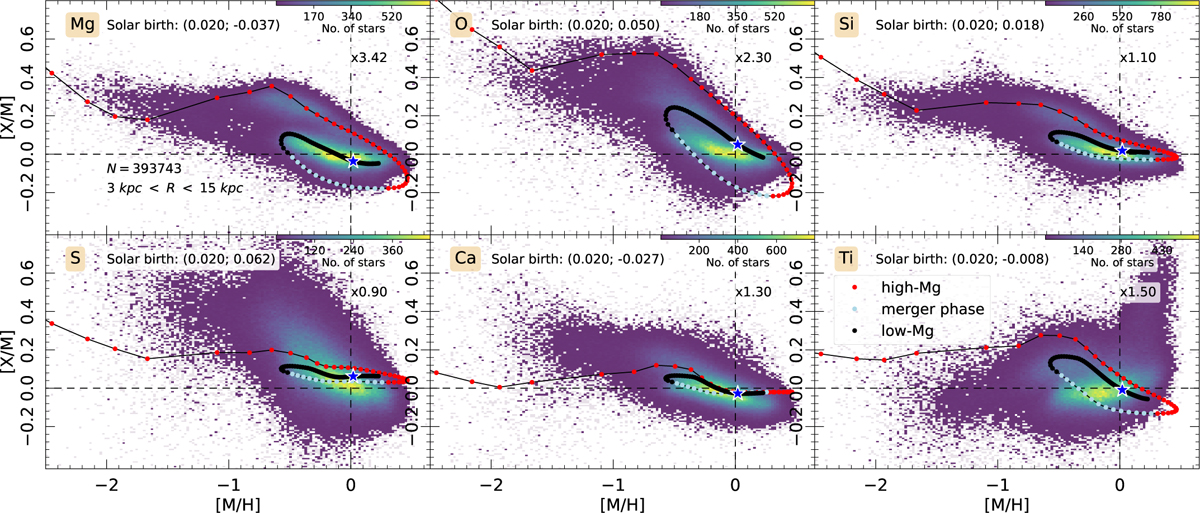
Observed [X/M] vs. [M/H] abundance ratios for the α-elements (O, Mg, Si, S, Ca, Ti) from MWM DR19 for the entire galactocentric region between 3 and 15 kpc compared with the best fit CE model results (dotted curves) for all species. The spacing between the dots represent the discrete evaluation points during the time of the GCE simulation. The color coding represents the number of stars on the observational chemical map of the MW, and grey squares represent bins containing a single star. The red and black filled circles mark the path of the high-Mg and low-Mg stellar sequences, respectively, while the gray dots correspond to the so-called merger phase. This color coding is the same as in Fig. 12 and the top panel of Fig. 6. In each panel, the metallicity and [X/M] abundance ratio are displayed at the exact time of the Sun’s birth during the simulation, which is also marked with a star symbol. The multiplication factor applied for the stellar nucleosynthetic yields of the relevant element is also indicated in the upper right corner of the plots.
Current usage metrics show cumulative count of Article Views (full-text article views including HTML views, PDF and ePub downloads, according to the available data) and Abstracts Views on Vision4Press platform.
Data correspond to usage on the plateform after 2015. The current usage metrics is available 48-96 hours after online publication and is updated daily on week days.
Initial download of the metrics may take a while.


